Adaptable Wealth site logo
Search
Investing is stocks - Bulls vs Bears

A Beginner’s Guide to Investing in Stocks

Home >> Invest >> A Beginner’s Guide to Investing in Stocks

Investing in stocks has proven over the past 100 years to be one of the best ways to build financial wealth for all who have participated. There is a place for the slow and steady 401k investor. There is a place for the retiree living off their savings. You also have the investment institutions who use it as a casino, and many more.

Regardless of your place in the market, it’s a platform that can help carry those who participate to financial freedom. The key is participation. Consistent and long-term participation.

In this article, we will learn about what stocks are and a few ways that the stock market is broken into different segments. You’ll also learn about your personal risk tolerance and how to gauge it, and finally, we will cover how stocks can help you achieve your financial goals through returns and diversification.

With this knowledge I hope to help you determine what portion of your financial wealth you want to put in stocks. 

But first, what exactly is a stock?

A share of stock is essentially a representation of fractional “ownership” in a company. I put ownership in quotes because you don’t really own anything other than the digital certificate associated with a share. Unless you own a very large portion of the shares outstanding, you have practically no influence on the corporation.

You simply have the ability to buy and sell shares with the goal of generating a profit by selling it at a higher price than what you paid, by collecting dividends, or through some type of tax strategy.

You also have a claim on the proceeds from the sale of the company’s assets should it go out of business. 1

Every stock, mutual fund and ETF has its own risk/return characteristics that you should understand before investing.

Because I can’t give you the risk/return profile of every single stock, I’ll have to use indexes which are commonly used to represent segments of the overall stock market.

     
       Summary
  • A share of stock is essentially a representation of fractional “ownership” in a company
  • US stocks have had positive real returns in 73 of the last 100 years and have returned 7.63%/yr over that period
  • An allocation to stocks is advisable but the exact percentage of your portfolio depends on many things such as: your age, when you need to use the money, your targeted return and your risk tolerance.
  • Stocks are commonly segmented into size, location and style 
  • Investing in stocks across the size and style spectrum provide diversification due to low correlations and strong returns in most of the styles.
  • Mid & small Cap value stocks have outperformed all others on a risk adjusted basis since 1980. A caveat being that large growth is not far behind and has clobbered all others over the past 7 years.
Pros & Cons of Stocks
Pros
  • Most are easy to buy and easy to sell 

just make sure you check the trade volumes & bid/ask spreads before you invest as this will give you a gauge of liquidity.


Large daily volumes and narrow bid/ask spreads are desirable.


  • Some provide a Cash flow

Many pay dividends which helps increase the probability of a profitable investment. It puts a kind of floor under your returns


  • Tax advantages.

Holding an investment for longer than a year qualifies you for long-term capital gains (rather than short term capital gains) and a lower tax rate on your profits


  • Good historical returns that beat inflation


S&P 500 real returns - since 1920


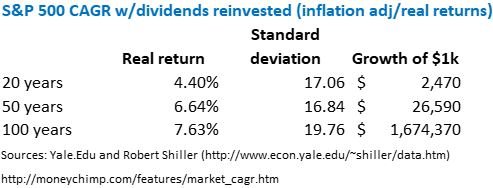
If you invest in stocks over long periods of time, it is quite likely that your purchasing power will increase at a pretty good rate (4-8%).


  • Many low-cost options available

You can get decent returns through low cost ETF’s and mutual funds. Commission free trades are standard for most stock trades these days.


  • Diversification as a part of a portfolio of many assets

Stock returns are uncorrelated or lowly correlated with many different assets. Investing in stocks as part of a multi asset portfolio is nearly certain to increase your risk adjusted returns versus a portfolio without stocks.


Cons

There are ways to reduce or even eliminate some of these risks. You can never eliminate all risks.


  • Quite volatile

As you can see in the chart above, the variability (as measured by standard deviation) has been 3-4 times more than the return received.


In investment lingo, your risk/return ratio is less than one.


  • You can lose money, including your entire investment.

As a matter of fact, it’s likely that you’ll lose money on several of your investments the longer you invest.


  • It takes time. In more than one way

First, It takes time to research an investment. Because of the thousands of options, it’s easy to get overwhelmed and spend a ton of time trying to find the “perfect” investment.


Second, you gotta be patient. In any given year you can receive returns that are either low or downright negative. Hell, in any given 2-10 year period you can receive low or negative returns. It’s unlikely but is possible.


The best approach for most people is to invest over the long term which, by definition, takes time.


  • You’re competing with bots/algorithms

Because there is so much money to be made, large investors such as hedge funds, banks, institutional investors etc., have written computer programs to take advantage of what seems like every possible opportunity in the market.


This can negatively affect you by reducing your returns.


A metric you have no idea about hits a certain threshold and triggers their bots to sell.


Stock market segmentation

The last piece we need to understand before diving into historical risks and returns is how the market is segmented.

Within the stock market there are several ways to categorize the different types of companies you can invest in. The most common being the size of the company, the growth style and the location of the company.

Size

There are two main ways to classify a company based on size: Revenues and Market capitalization.

 
Revenues


In my opinion, this is the correct way to categorize a company’s size because it is the actual quantification of the amount of business it is doing.


Market Cap


Market Cap = price per share * # of shares outstanding.


This is the way you will hear companies size discussed in the media.


Large cap = $10B+ market cap

Mid cap = $2-$10B market cap

Small cap = $250 Mill – $2B market cap

Micro cap = less than $250 mill


For the most part, revenues and market cap will both result in the same size classification but in some cases they don’t. Let’s say a stock gets hot, the price is bid up and/or they sell a bunch of shares to finance their operations. The market cap could move into a classification that it doesn’t really belong in.


You could be investing in a mid size company thinking it’s a large company if you go by market cap.

Style

Style is the method of segmenting companies based on their growth rate and share price relative to the value of the fundamentals such as revenue, profitability and financial strength.


There are three main styles: Growth, Value and Blended.

 
Growth


These are companies that usually have some type of competitive advantage.


They could have found an unserved or underserved niche, they could have developed a new product or technology, or they could just be the beneficiary of a new fad (hello fidget spinners, hacky sacks, pet rocks).


Revenues and earnings are growing at a faster rate than the market average and, because of this, these stocks usually trade at higher prices relative to their underlying fundamentals. 


Most don’t pay a dividend.


Since they’re growing at such a high rate, the benefit of investing excess cash back into the business exceeds paying investors a dividend. If one does pay a dividend, it is almost always less than 1% of the share price.


Finally, growth stocks fall on the right side of the risk/return spectrum. They can be much more volatile than other stocks because their price is heavily influenced by expectations of high growth. If the growth rate falls short of expectations for any reason at all, the price can plummet quickly.


On the other hand, if they keep up their growth and expectations, the return can be 25%, 50%, 100% or more.


Value


These are companies that, for many possible reasons, are trading at a discount relative to their fundamentals. And many of them pay decent dividends as a % of their share price (dividend yield).


The value category tends to be more nuanced than growth because there are tons of reasons a company could be selling at a discount, such as:


  • They didn’t meet or beat expectations

It’s not uncommon for high flying growth stocks to run into a rough patch. Their revenues fall short of expectations for an extended period of time and their share price gets hammered to the point that they are now trading at a 20 price to earnings multiple rather than 60.


Their price to cash flow is now 10 instead of 25 etc.


  • The sector they’re in falls out of favor.
  • An overall market correction (usually a recession) brings prices down 30-40%, pulling tons of companies into value territory.
  • They could be part of an investigation by the SEC or another legal entity for some type of misconduct.
  • They are older or larger companies that no longer have the sales and earnings growth potential that other companies do.

This is probably the most common cause of a company’s stock trading for less than what the fundamentals suggest it is worth.


Frequently, a company is trading lower than their fundamentals for a good reason and it’s only a matter of time until their fundamentals deteriorate and the appearance of being undervalued goes away. This is referred to as the value trap.


You could buy a company that you think can bounce back. You tell yourself that the decline in revenues is just a short-term thing. It’ll bounce back and you’ll reap the rewards a year or two down the line. If that ends up not being the case and the company is permanently damaged or doesn’t recover for 5 years, you will have lost money. You could wait the 5 years for the bounce but in the meantime, your money is sitting there doing very little while it could be growing in other investments.


The key to value investing is doing enough research so you are quite sure that the reduced share price is a short-term thing and is just a result of markets having ADD.


Although value stocks come with risks related to the growth of the company and the performance of their stock, one thing is for sure. Their price is less volatile than their growth counterparts.


For the most part they have fewer down years and the average loss during down years is lower than that of growth.


Blend


Blended is a third category of stocks but it’s not really its own category. A particular stock generally belongs to either the growth or value category.


However, there are some scenarios where a growth stock suffers a large decline in stock price but the company’s growth prospects are still intact.


This is what is referred to a blended stock. These are the stocks that will be big gainers if you hold long enough and the anticipated long-term growth trend continues.


These are the stocks that you want to pounce on, as long as you do your homework and know what you’re purchasing.


The other way you’ll hear about a blend is in mutual funds or ETF’s. While pure growth funds will invest almost entirely in growth stocks and value funds will invest almost entirely in value stocks, blended funds will hold a significant portion of its assets in both.  

Geography

Unlike the segmentation of companies by size or style, segmentation based on geography is relative. Me, living in Merica, refer to all other countries as “international” but someone living in Canadia refers to Merica as international.


Just so we are all on the same pg, I will be using Merica as the domestic country and all others as international.


There are 2 main ways to segment countries into investable regions: By each country’s state of economic and societal development, or by their geographic region.


Geographic region is straightforward. when you hear Asia or Europe, you know exactly where they are. Not to mention that saying that you’re investing in Asia tells you nothing about the investing landscape of a country.


Because of this, we will focus only on a country’s state of economic and societal development


Economic and Societal Development and Security


When it comes to gauging a nation’s economic and societal development and security, the investment community generally relies on: 


  • Income per capita
  • Freedom of economic activity and capital flow
  • The level of industrialization and quality of infrastructure.
  • Robustness of societal and business security, and contractual law
  • Standard of living 

The standard of living attempts to quantify non-economic factors such as a nation’s level of education, health and happiness.


The countries that have a high income per capita, strong contractual and business law, high standards of living and a robust infrastructure are called “Developed” countries.


As you go down the development spectrum, emerging market countries are well on their way towards “developed” but still have a significant way to go to become fully developed.


The bottom countries are referred to as frontier markets.


  • Developed

These are countries with


    • Relatively high income per capita and standards of living
    • Strong contractual and business law
    • Robust infrastructure and technology
    • Few restrictions on capital flows and business activity

This includes the worlds most recognized countries such as the US, Canadia, Great Brittan, Germany, France, Italy, Japan etc.


But there are two notable countries that are not included in this classification: China and Russia.


They are considered to be a step down


  • Emerging

 These are countries that are in the process of becoming a developed economy.  Common characteristics include:


    • moderate income per capita and standard of living
    • Existing but potentially sketchy contractual and business law systems
    • Good to decent infrastructure and technology
    • Capital controls are more frequently used
    • Potential political instability
    • Large currency fluctuations are not uncommon

This includes countries like China, Russia, Mexico, India, Saudi Arabia and a lot of the Asian pacific.


This is where investors usually go to target higher returns. As I will demonstrate later, there definitely is the potential for higher returns but the cherry of top is the lack of correlation to developed markets.


Having said that, we’ve seen the correlation of stock returns increase over the past 20-30 years to the point that it’s getting harder and harder to find a solid stock that offers low double digit returns and little correlation to developed markets.


Because of this, investors have been moving into frontier markets.


  • Frontier

These are countries that are behind on development. These are the third world countries like Vietnam, Romania, Kenya, Bahrain, Bangladesh etc.


Investing in stocks in these countries is much more risky. Take the common characteristics of emerging markets and add, in many cases, poor liquidity, inadequate regulation and lackluster financial reporting.


Because of the additional risk, expected returns are higher as well. I say expected because the data does not fully support this expectation of higher returns for long term investors.


These may be countries where you gotta get in, score a profit and get out as quickly as possible.

Considerations when investing in stocks

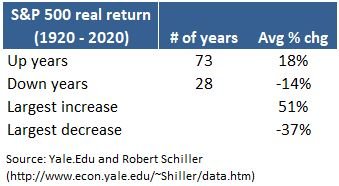
Out of the last 100 years, the S&P500 has generated positive real returns in 73 of those years. The average real return was +18%/yr. Because of this long track record of consistently positive real returns, anyone with money invested should have a portion of their portfolio invested in stocks.

The appropriate percentage for your portfolio depends primarily on 3 areas:

  • Returns you need to meet your goals 
  • Risks and chances of loss you are willing to accept in order to obtain that level of returns.
  • The diversification benefit you can realize by adding stocks to your portfolio.

As I mentioned earlier, it is overwhelmingly likely that you’ll receive positive real returns in any given year. But you better be willing and able to accept losses when investing in stocks.

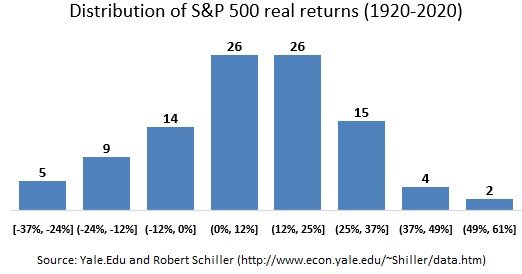
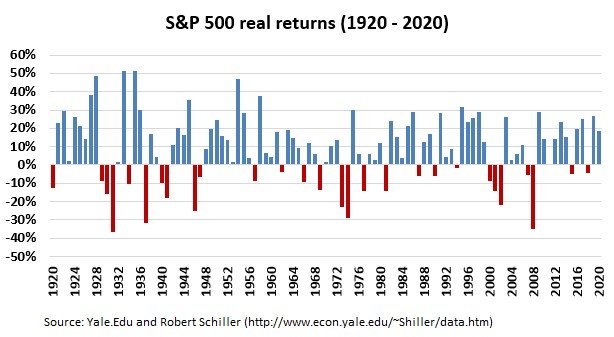
Here are a few charts to help you get an idea of the returns you are likely to receive if investing over the long-term.

S&P 500 up years and down years table 1920-2020


Return distribution of S&P 500 1920-2020


S&P 500 real returns bar chart 1920-2020

What is your risk tolerance?

Risk tolerance is how well you are able to handle fluctuations in the value of your investments. Primarily losses. 

In general, the more risk you are willing to live with, the higher the potential return of your portfolio. Notice I said potential. Just because you take more risk doesn’t mean you automatically generate higher returns. You could just end up loosing more than you otherwise would have.

As time goes on you’ll get closer and closer to needing to use the money (and you’re getting older!) so the additional risk is not worth the incremental increase in your assets. You’ll tend to drift towards less risky investments.

To gauge your risk tolerance you should answer the following 3 questions:

What is the $ for?

Money that is needed in the next 2-3 years should probably be held in more conservative investments such as high yield savings accounts or money market mutual funds/ETF’s.


Down payments on a car or house, savings for children’s college that will be used in the next year or two, savings for your upcoming wedding, a travel fund etc., are all instances where you’d want to be more conservative with that money.


Your ability to be conservative with the money is highly dependent on the inflation rate.


If inflation is not a problem and you can maintain your purchasing power by keeping the money in ultra-safe investments, then it’s usually the best to do so.


On the other hand, if the prices of the items that you intend to spend the money on are increasing faster than the interest rate you’re receiving in conservative investments, then you almost have to consider keeping at least a portion invested to try to maintain your purchasing power.


The percentage is up to you but in most circumstances it’s probably smartest to keep at least 40-50% in safe investments unless inflation is super high, like 10% or more.   


bonds - risk tolerance - what is the money for

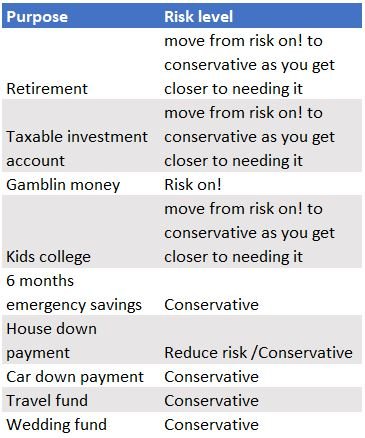
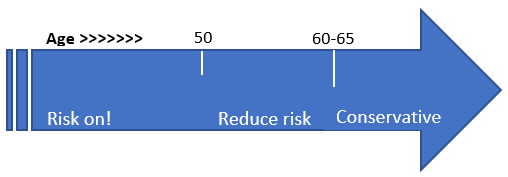
How long until you need the money?

If you are young and don’t need the money for a long time (retirement money), then mathematically speaking, you can afford to have a fairly large portion of your portfolio allocated to riskier investments offering higher returns.


If you receive poor returns for a few years (even 5 years), you’ll have plenty of time to recover.


The older you are, or the closer you get to needing the money, the generally accepted wisdom is to reduce risk. It’s wise to allocate a smaller portion to riskier assets and to increase your allocation to safer assets like cash, money market funds and/or bonds.


bonds - risk tolerance - how old are you

Can you stomach the risk?

Are you a person who can ignore market fluctuations and hold on for the long term?


If so, there is nothing wrong with taking on risk in pursuit of higher returns. As always, make sure you understand the risks and have a backup plan incase it backfires and ends up costing you money that you should have been protecting.


A useful exercise is to ask yourself, If I lost 40% of this money:


  • Would it severely affect my daily financial situation?
  • Would it cause undue stress and negatively affect my health or happiness?
  • Would it jeopardize the goal for which I’m investing?


If you answer yes, to any of these questions it’s probably too much risk for you.


Ask yourself the same questions if you lost 25% of the money, and again if you lost 15% of the money and so on.


Generally, you have to be willing to take a 30% loss to invest in the stock market. Most of the time you will make money, especially over long periods of 10 years or more, but big losses do come around once every 10-15 years.
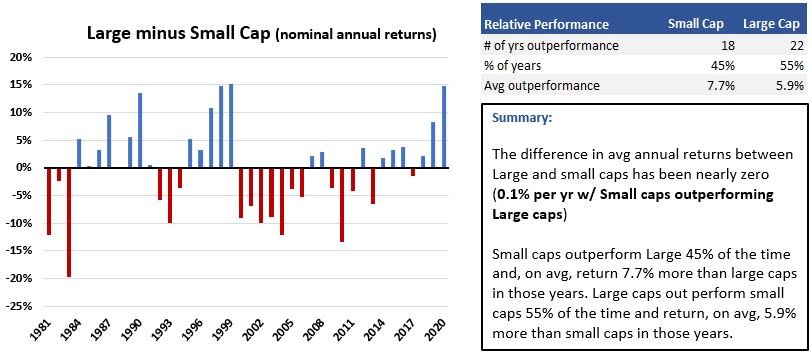
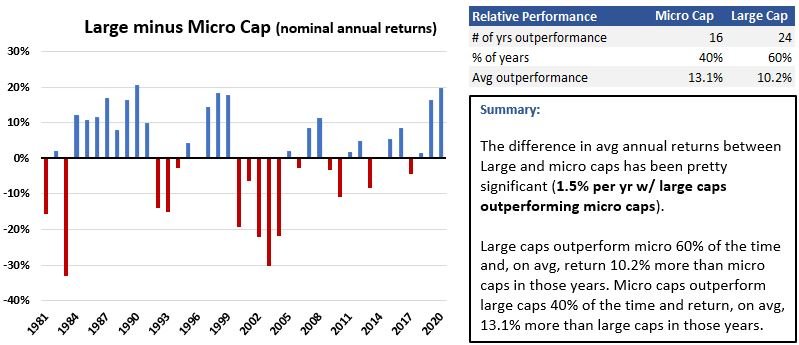
Historical risk & return metrics of stocks

So far, we’ve learned about what a stocks is and how the investments within the stock market are segmented. We’ve also discussed the high level returns over the past 100 years and a few questions you should answer to get a better understanding of your risk tolerance.

Now let’s dig further into returns but this time at a more granular level. Let’s see if we can find any segments of the stock market that have historically performed better than others.

Size

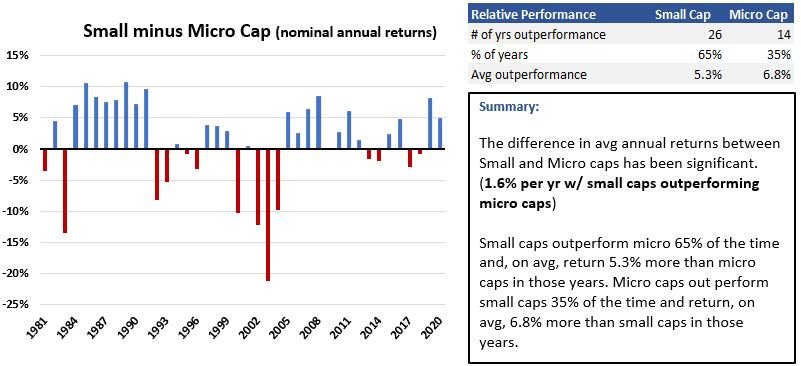
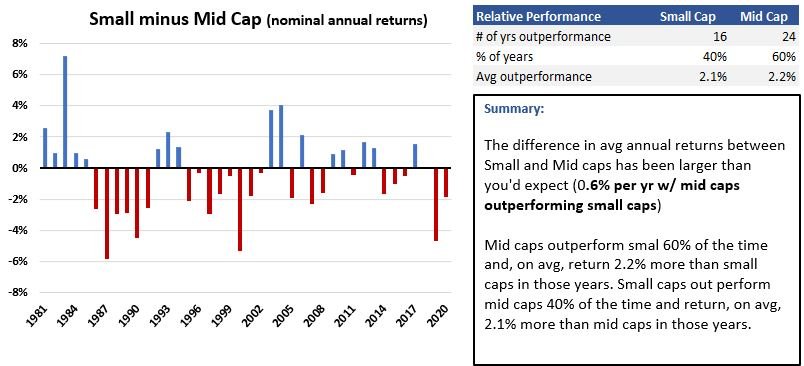
You’ll usually hear people claim that the expected return increases as you go down the size spectrum. This has some truth but is not necessarily the case and is highly dependent on the time frame that you choose.


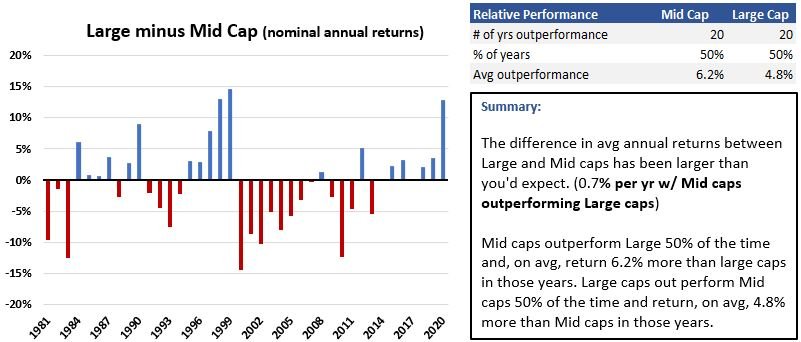
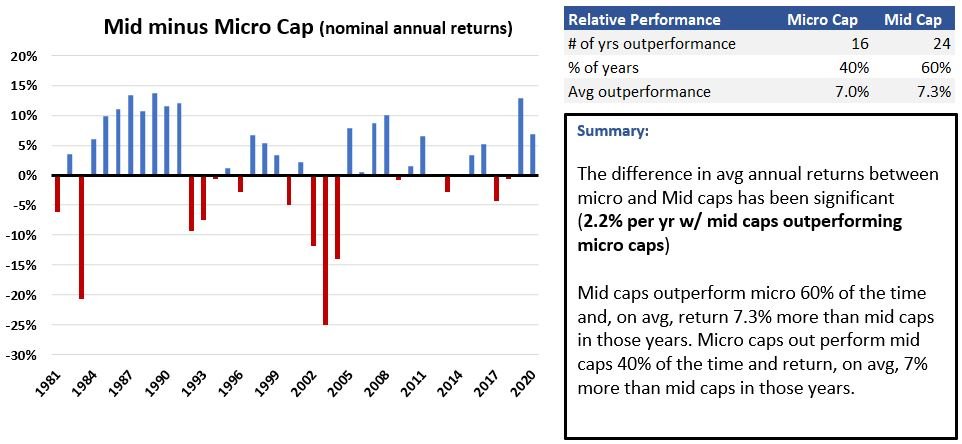
Since 1980, Mid caps have lead the pack on a total return and risk adjusted basis. And it’s not just the Compound Annual Growth Rate (CAGR) over this 40 year period. Mid cap beat all other sizes over 3, 5 & 10 year rolling periods.


Growth of $10k - Large vs Mid vs Small cap stocks


US stocks risk return table - since 1980


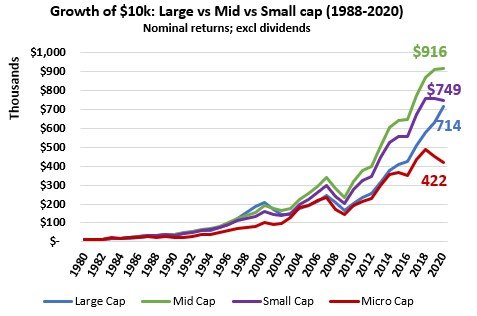
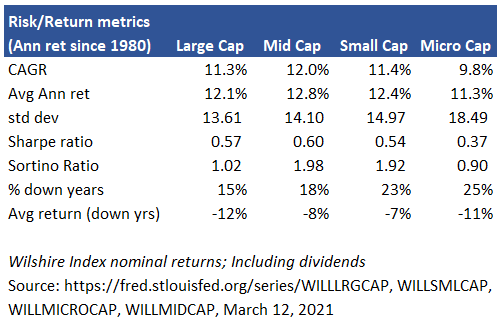
There is one caveat. Large cap has mopped the floor with all of them the last 7 years by an average of 4.6%/yr over small, 6.7%/yr over micro and 3.4%/yr over Mid! (Primarily on the backs of the Facebook, Google, Amazon and Microsoft cartel + Netflix.) 


As a matter of fact, the outperformance of Mid-caps over the 40-year period shown above is not statistically significant vs large or small caps. This is a reminder that past returns are not a guarantee of future returns and that any of the categories can outperform the others in any given day, week or year. So, do your own research before making any investment decisions.


However, such a large outperformance warrants the consideration of increasing your allocation to mid-caps, especially for longer term investors.
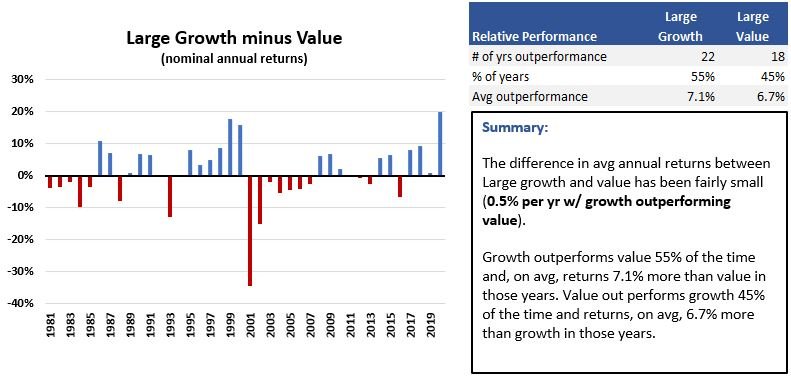
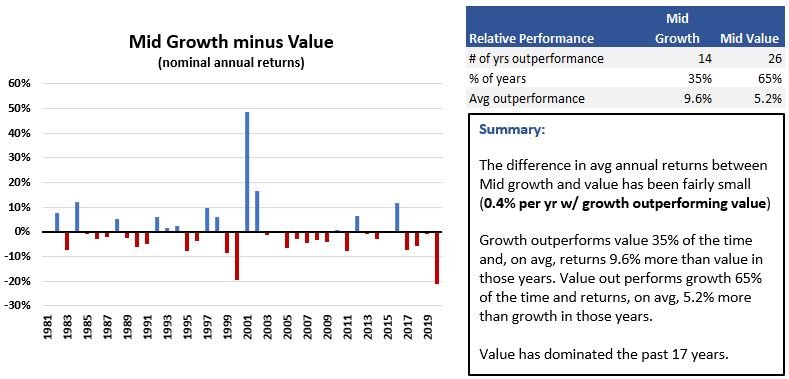
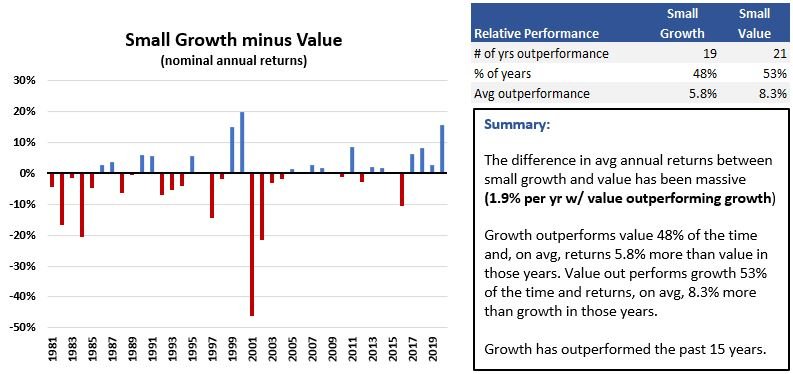
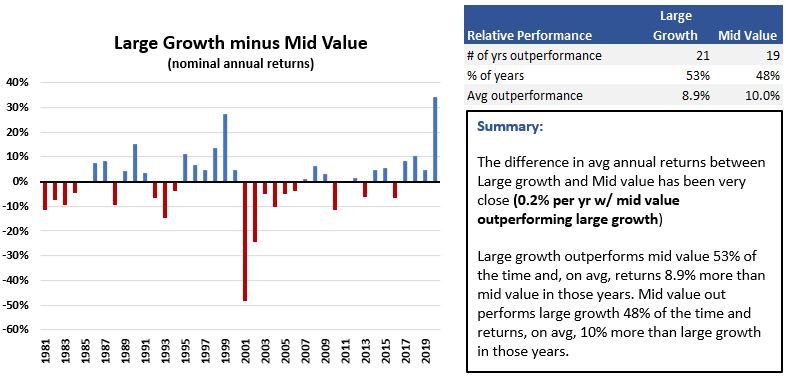
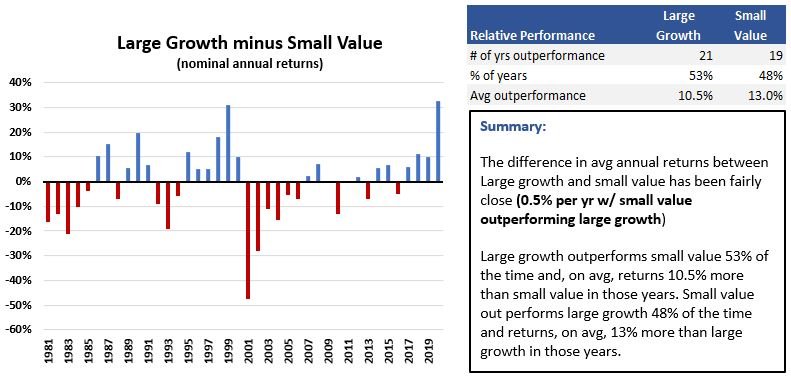
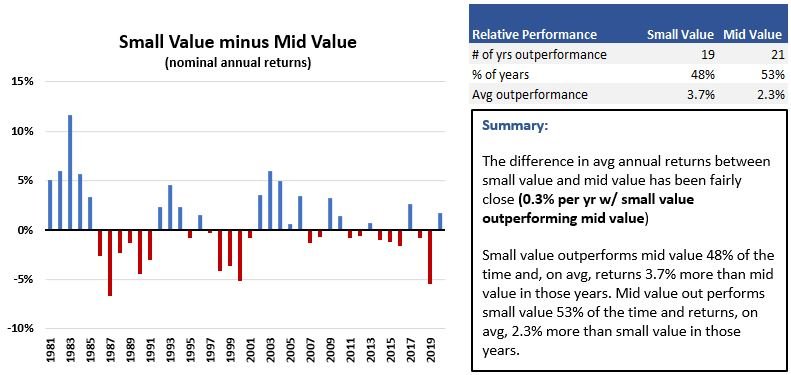
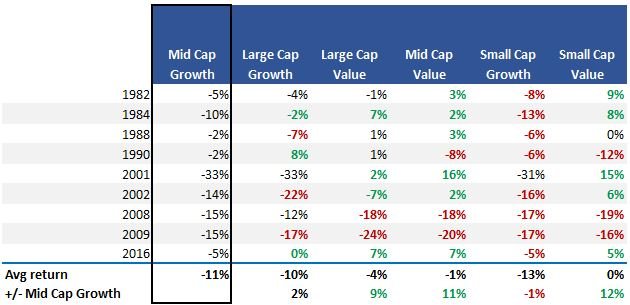
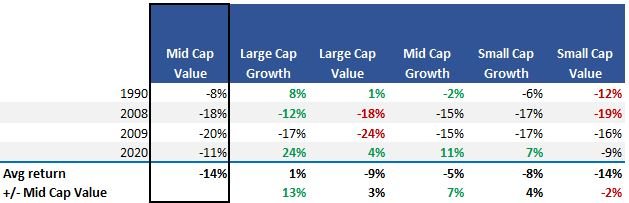
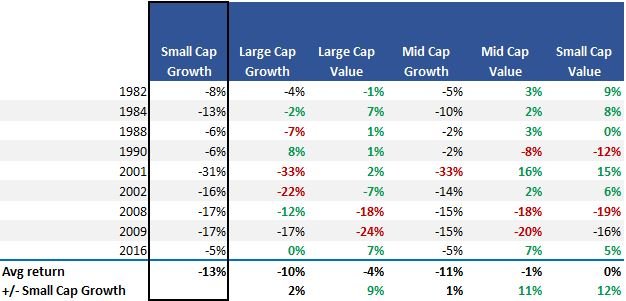
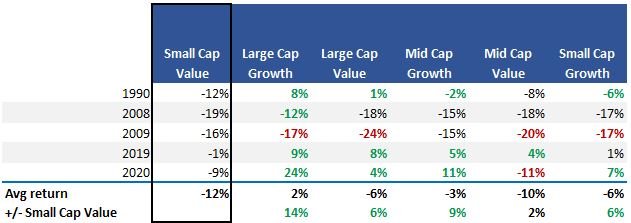
 

Large vs Small cap relative performance chart and table - since 1980

Large vs Micro cap relative performance chart and table - since 1980

Large vs Mid cap relative performance chart and table - since 1980

small vs Micro cap relative performance chart and table - since 1980

small vs Mid cap relative performance chart and table - since 1980

Mid vs micro cap relative performance chart and table - since 1980

Style

As a reminder, when we refer to a stock’s “style”, we’re talking about whether it’s a growth stock or value stock. You’ll also hear about a blend of the two, usually when investing in mutual funds or ETF’s. 


Growth of $10k - Growth vs value stock returns across the size spectrum - since 1980


risk return metrics - us stock returns by style - since 1980


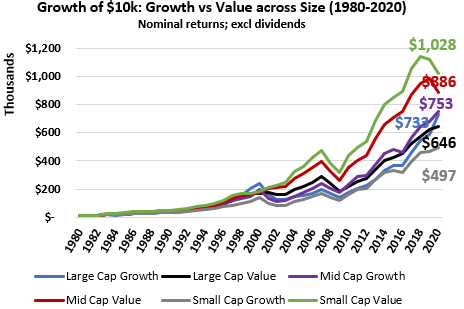
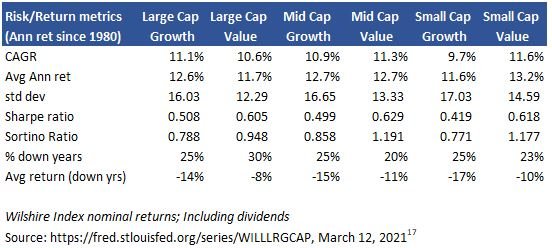
On a risk adjusted basis mid cap value nudges out small cap value due to lower price volatility. But on a CAGR basis, Small cap value has performed the best since 1980.


There is one caveat. Large cap growth outperformed all of them 6 of the last 7 years primarily on the backs of the Facebook, Google, Amazon and Microsoft cartel + Netflix.  


Large growth vs value relative performance chart and table - since 1980

Mid growth vs value relative performance chart and table - since 1980

Small growth vs value relative performance chart and table - since 1980

Large growth vs mid value relative performance chart and table - since 1980

Large growth vs small value relative performance chart and table - since 1980

small value vs mid value relative performance chart and table - since 1980

Geography

International vs US stock returns and correlations - since 2008 - Developed Markets

International vs US stock returns and correlations - since 2008 - Emerging Markets

International vs US stock returns and correlations - since 2008 - Frontier Markets


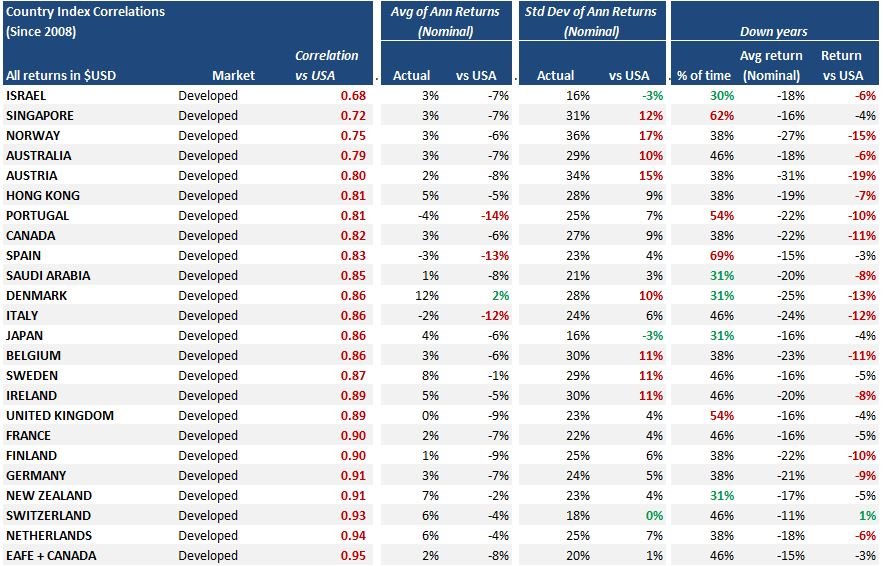
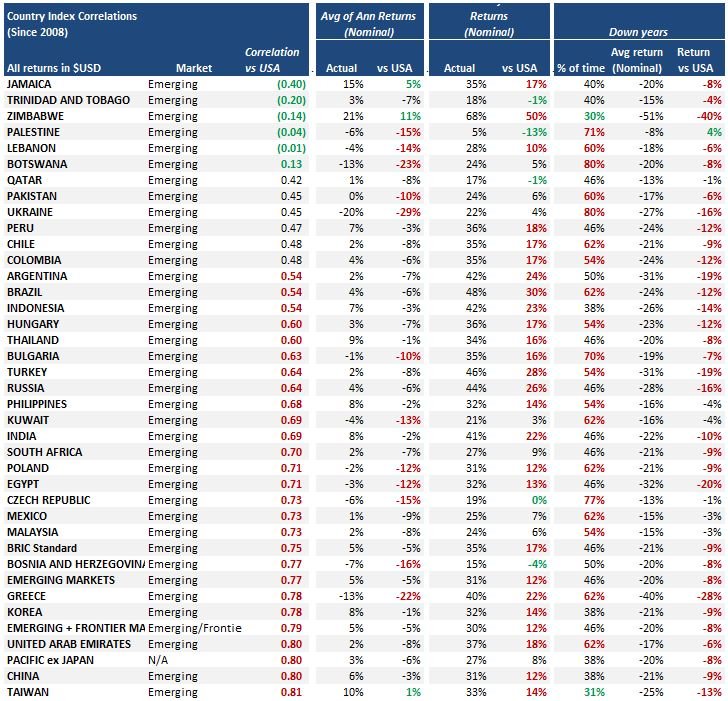
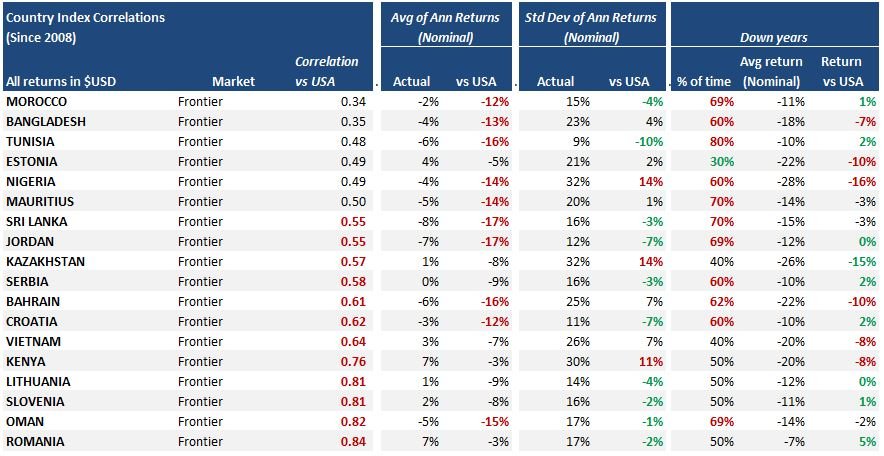
Based on the above data, it seems to me that there are only a few countries worth taking a look at. They’re the ones that have a low enough correlation to US stocks and a high enough return to be worth the additional risk.


Surprisingly, the two most obvious candidates are…GULP…..Jamaica and Zimbabwe!


I honestly didn’t think I’d find this.


  • Jamaica – Get a 15%/yr return to potentially lose 20% of your money more than 1 out of every 3 years?
  • Zimbabwe – Trade a 21%/yr return for the risk of losing 51% of your money (!!!) about 1 out of every 3 years?
  • Taiwan – Accept a high correlation with US stocks in exchange for 10%/yr returns and a chance to lose 25% of your money about 1 out of every 3 years?
  • Romania – 7%/yr returns with an even higher correlation to US stocks in exchange for a 7% loss every two years?
  • Denmark – 12%/yr returns with a still higher correlation to US stocks in exchange for a 25% loss about 1 out of every 3 years?


The primary purpose of investing internationally is to not only goose your returns but to also hold an investment that is uncorrelated or lowly correlated to US stocks. If you can’t get an investment that is not correlated or at least very lowly correlated to US stocks, what is the point of taking the extra risk?


We will explore the diversification benefits in the next section, but you can clearly see from the data that there are only a couple options worth considering.

Diversification across stocks

Think of diversification as decentralizing your investments. it’s the strategy of putting a portion of your financial wealth in different investments whos returns are lightly correlated, uncorrelated or even negatively correlated to your other investments. This way, you theoretically protect your whole nest egg from taking a nasty hit.

In order to assess diversification potential, I look at three metrics:

  • Correlation

Are the returns uncorrelated, negatively correlated or at worst lightly correlated with US stocks?

  • Are the returns high enough to justify the risk?

Just because it’s uncorrelated doesn’t mean that it’s a good investment to add to your portfolio. You want returns that are at least 2-3% higher than your alternative investment (US stocks in this case) or you’ll be reducing the risk adjusted returns of your portfolio.

  • How does the investment perform in the years that US stocks decline?

One of the primary tenets of diversification is the offsetting of declines in one area of your portfolio with gains in another area (or at least limiting losses by either holding their value or declining by a lower % than US stocks)

If an investment actually does worse in down years then what’s the point?

Style

US stocks - Linear correlation between styles w relative returns by style during down years - since 1980


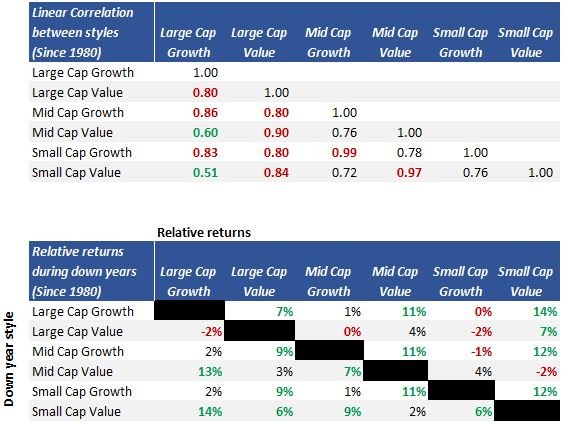
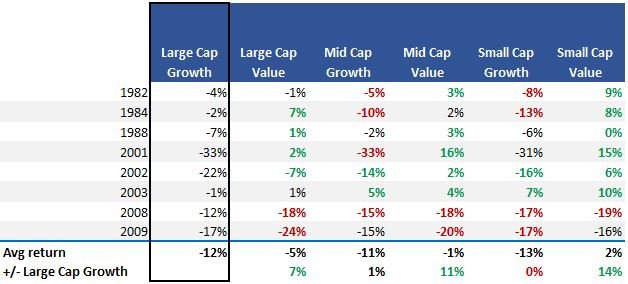
The churn is real! The correlations between cap sizes within a given style (i.e. growth vs growth or value vs value) are very high and performance is fairly close during down years regardless of the cap size.


In other words, when growth is down, all sizes under growth are dragged down and vise versa.


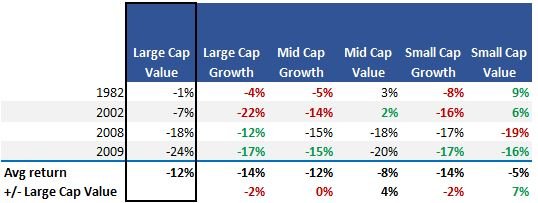
Similar with the value side, but value appears to hold up a little better between the cap sizes than growth does.


Out of all the styles, the two that seem to provide the best diversification are Mid cap value and Small cap value.


Not only do they have very low correlations to the growth side, they kill it when growth is down, and they hold up when large cap value is down.


US stocks - returns by style during Large growth down years - since 1980

US stocks - returns by style during Large value down years - since 1980

US stocks - returns by style during mid growth down years - since 1980

US stocks - returns by style during mid value down years - since 1980

US stocks - returns by style during small growth down years - since 1980

US stocks - returns by style during small value down years - since 1980


There is one large caveat here. When it comes to financial collapses like we had in the Great Financial Crisis, everything goes down with very few exceptions. From the data I’ve seen, only a couple of assets protected you from declines in 2008-09 and again in the Coronavirus flash crash of 2020…… Cash and US Government bonds.

Geography

International vs US stock returns and correlations - since 2008 - Developed Markets

International vs US stock returns and correlations - since 2008 - Emerging Markets

International vs US stock returns and correlations - since 2008 - Frontier Markets


Based on the above data from MSCI, almost all negatively or lowly correlated countries are emerging or frontier markets.


That’s one of the things that bugs me about international mutual funds and ETF’s. They tout diversification as a benefit of their investments, but a large majority are stacked with companies from countries that have very high correlations to the US (United Kingdom, France, Italy, Germany etc).


You’re not getting the diversification you think you are by investing in international funds or ETF’s. It’s mainly a marketing scheme.


If you want true diversification through low or negative correlation, you gotta go with Emerging or Frontier markets.


How about performance during down times in US stocks?


For 89% of the country specific indexes, they performed the same or worse than that US did.


Yet another data point suggesting that geographical diversification does not appear to increase overall returns of a portfolio. At least not since 2008 and through the indexes I’m using.


international stocks - returns by country during down US years - since 2008


international stocks - returns by year and country for US down years - since 2008


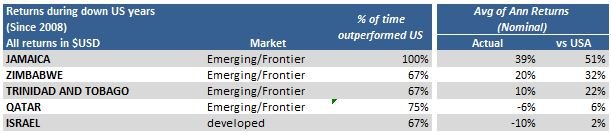
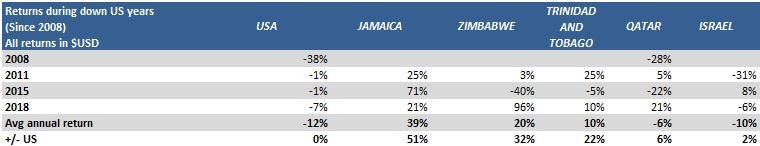
There were a couple countries that did stand out and almost all of them were emerging and frontier markets:

  • Jamaica – Once again Jamaica stands a top the list. And this wasn’t just one big year vs the US. Not only did it beat the US in all 3 of the last US down years, they outperformed by an average of 51%! And returns were heavily positive in all 3 years.
  • Zimbabwe – Another notably uncorrelated country, but the average return is heavily influenced by a +96% year. Go ahead and take your chances but be prepared to get kicked in the teeth
  • Trinidad & Tobago – The 2nd most uncorrelated country to the US has performed quite well the last 3 US down years. And the year that it didn’t outperform the US, they only lost 5% vs -1% for the US. Not like you lost 20% or something. The only caveat is that in all years, their return is nothing to write home about so take what you will from the fact that they have done well the past 3 US down years.
  • Qatar – Similar to Trinidad & Tobago in that it is highly uncorrelated to the US and has outperformed the US in each of the last 4 down years, including the great recession. The avg annual return in all years since 2008 is a measly 1% and almost 50% of those years were down years. Put that mouth guard in if you decide to invest here.
  • Israel – the only developed market to beat the US in more than 2 of the last 4 down years while also outperforming the US by an average of 2%/yr in those years. Don’t pass up the -31% return in a year that the US only lost 1% though. Another mouth guard country.


Investing in emerging and frontier markets is a call you have to make for yourself.


Of course, there are other factors you should investigate before investing in these types of countries (See the list of major risk factors above).


One caveat to this analysis is that I’m using MSCI indexes as proxy for the most probable returns you could expect because they are the primary benchmark used for many ETF’s and mutual funds. However, there are thousands of funds and ETF’s out there that won’t have an investment mix anything like these indexes.


Therefore, before adding any investments in the name of diversification, analyze the specific investment in terms of correlation to the other investments in your portfolio. See if it helps reduce expected variability while not compromising expected return too much.

The numbers support the strategy of holding a good chunk of your financial wealth in stocks spread across the size and value spectrum, and to a much smaller extent, across geographic regions.

The numbers show that it is prudent to have a healthy dose of Large growth, Mid value and small value stocks in your portfolio.

At least since 1980, these three sectors have done better than all others on an absolute and a risk adjusted basis. On top of that, their correlation to other stock segments is low enough to improve the diversification of your portfolio while increasing your return potential. The best of both worlds!

But let’s be honest with ourselves. If you think that owning a variety of stocks is going to reduce your losses during crashes like we’ve had twice in the past 12 years and three times in the past 20 years, you’ve been sipping on grandpa’s cough syrup.

Other options include bonds, real estate, precious metals and crypto. None of them are perfect but each adds a piece to a portfolio designed to consistently build financial wealth.

No matter what you decide, think several steps ahead and don’t get set on one way where you’re screwed if things don’t go as planned. Planning leads to options, options lead to adaptability.

¹U.S. Securities Exchange Commission (2009) Bankruptcy: What happens when public companies go bankrupt available at : https://www.sec.gov/reportspubs/investor-publications/investorpubsbankrupthtm.html (accessed: March 2021)

² US IRS Topic 409: Capital Gains and Losses. https://www.irs.gov/taxtopics/tc409

S&P 500 historical return metrics source: Yale.Edu and Robert Shiller. http://www.econ.yale.edu/~shiller/data.htm

US stock related metrics taken from St. Louis' Federal Reserve databased (FRED). Wilshire Index. https://fred.stlouisfed.org/series/WILLLRGCAP

MSCI Index level historical data was used for all international return and correlation metrics. https://www.msci.com/end-of-day-history?chart=regional&priceLevel=41&scope=R&currency=15&indexId=2591&size=36&style=C&priceLevel=41

Get Our Latest Delivered To Your Inbox

You will receive 1-2 emails per month and you can unsubscribe at anytime

Jump To

Most popular investing