

In my last article, The Hidden Risks of Index Funds, I outlined some of the risks lying below the surface of these popular investment vehicles. Risks you’re taking with your hard-earned money & you don’t even know it.
One of these risks is the fact that when you buy a share of an index fund, most of your money is going into companies that you wouldn’t want to invest in to begin with.
Companies like Elevance Health, Chubb Limited, IQVA Holdings, XCEL Energy, or Fifth Third Bancorp. These are all mediocre companies at best. The only reason they’re in the S&P 500 is because they meet the flimsy requirements to be included.
What are those requirements you ask?
A company’s market cap must be in the top 500 of U.S. publicly traded companies.[1]
Market Cap = price per share * # of shares outstanding
This is one of the more stringent requirements because of the time required to build market cap. However, a company can simply issue more shares to increase its market cap. Provided there is a viable underlying business or there is enough hype around a product/service, keeping the share price stable & issuing new shares to finance the business is not hard to do.
But I’m not interested in owning viable businesses or businesses with short-term hype around their product/service. I’m looking for the best & forget the rest. In fact, I don’t directly consider market cap when doing fundamental stock analysis.
It would be better if the requirement was on profitability or cash flow.
A company must be profitable over the prior 12 months & the most recent quarter. [1]
This is a very flimsy rule for admittance into the “best 500 American companies”. A company that loses $1 billion over the first 3 quarters & then makes $1.2B in Q4 meets this requirement.
Does that sound like a company you want to own? I didn’t think so.
This is one I wholeheartedly agree with. A company considered to be one of the best publicly traded companies in America should have:
- At least 50% of its stock available for trading (the float) on exchanges. [1]
Makes sense right? If a company is 60% owned by its founder, then it’s more of a privately held company than it is publicly traded.
- The volume of shares traded each year has to exceed the float. [1]
When I analyze stocks, I make sure that at least 1M shares trade on average each day. Anything less increases the liquidity risk of owning those shares.
This means that it’s headquartered in America, it files its regulatory filings with the SEC, it has a plurality of assets located & revenue generated within the U.S., & it’s listed on an American stock exchange like the NYSE or NASDAQ. [1]
Yeah, that’s right. Even though a company meets all of these criteria, it may not make it into the S&P 500 because the self-appointed committee said so.
I don’t know about you, but I don’t want to be forced to put my money into companies that don’t meet my “Invest in the best & forget the rest” criteria. So, in this article, I want to show you step by step how to analyze a stock so that you can invest wisely, only in the world’s best companies.
Key Points
- When you buy an index fund, you're buying hundreds of companies that are subpar at best. I prefer to focus on the best & forget the rest.
- There a 7 basic steps to analyze a stock:
- Screening (Focus on the best, forget the rest)
- Review the financials (Don't fear the financials)
- Compare to competitors (Crush the competition)
- Understand the qualitative aspects of the company (Qualitative is just as important as the quantitative)
- Pinpoint their competitive advantage (Competitive advantage is key)
- Be aware of the risks
- Estimate what a share in the company is worth
Focus on the Best & Ditch the Rest
First, you gotta find the companies you’re interested in. You can do this by screening stocks for specific criteria. There are tons of different criteria that people use but the most common are:
The Growth Rate of Revenues, Net Income, EPS, or FCF
You could restrict your potential pool of stocks to only companies with revenue growth of at least 10%/yr. on average over the last 5 years. This is a common criterion for growth investors.
Or perhaps you’re interested in companies that have grown their Free Cash Flow (FCF) by at least 10% on average over the past 10 years like I am.
Revenues, Net Income & Earning per Share (EPS), rely on accrual-based accounting principles & don’t always show the most accurate picture of a company’s performance or financial fortitude. FCF is as pure a metric as you can get when it comes to gauging company performance.
Valuation
You could also screen based on stock valuation by eliminating companies based on the Price to Earnings (P/E), Price to Book (P/B), Price to Sales (P/S), or Price/FCF (P/FCF) measures.
For example, you could restrict the stocks to only those with a P/E ratio < 20 or P/FCF <= 10.
These types of stock valuation criteria are common for value investors.
Dividend Investing
Another popular investing strategy is dividend investing.
You could exclude stocks that offer less than a 3% Dividend Yield.
Always check the Payout & Coverage ratios when investing specifically for dividends.
It may take some time & experimentation to figure out what qualities you like to screen on. I personally screen for the following because these are characteristics that all the best companies in the world share, especially the first 3.
- ROIC 20% or higher
- Debt/Equity 60% or lower
- Revenue, EPS & FCF growth of at least 10%/yr. over the past 10 years
- Dividend Payout Ratio of 50% or less
- Morningstar wide moat
- 3-star Morningstar rating or higher
The results from my screen are as follows:
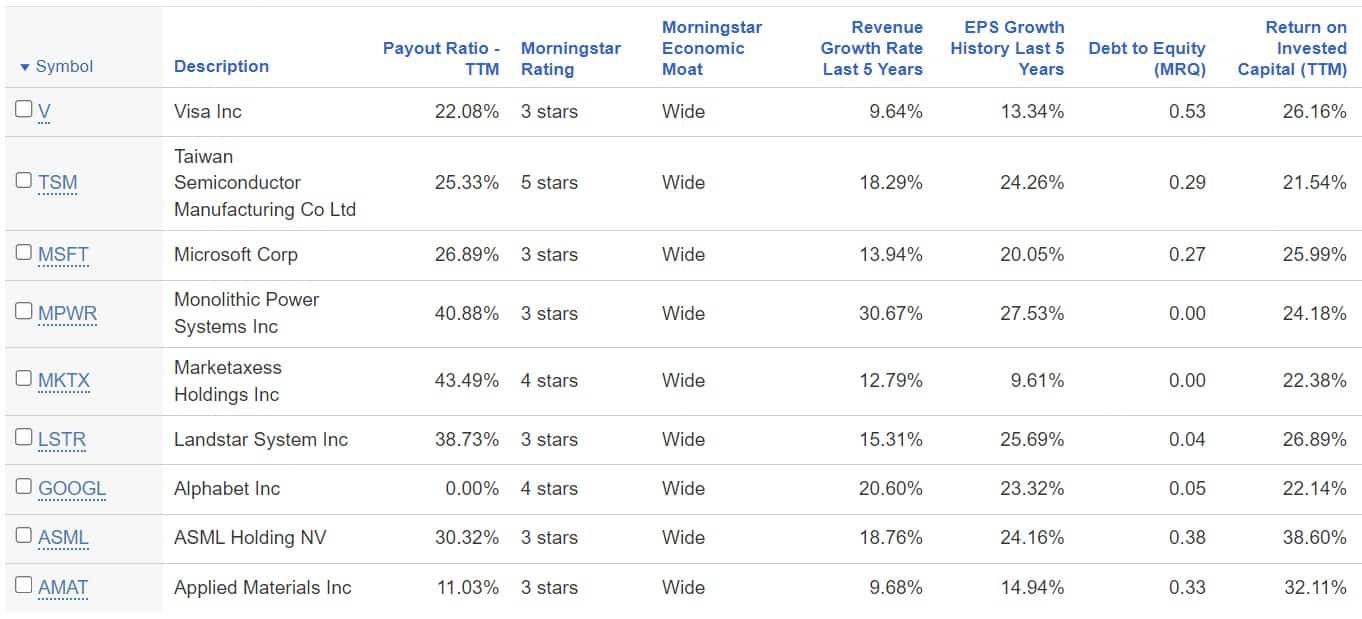
Now that we have a list of stocks, we need to quickly review each one to determine if it’s a potential candidate for a long-term investment.
For this I use a program called Qualtrim. This is the program that Joseph Carlson over there on the Joseph Carlson Show has developed. I gotta say, it’s a great tool! It’s the best that I’ve found for the quick, high-level fundamental stock analysis that I want to do.
It helps me quickly identify the best stocks so I can spend my valuable time researching those companies rather than wasting my time on mediocre or crappy ones.
I’ve already gone through all these companies &, although there are some very good ones here, we’re going to focus on Visa stock.
It’s a stock that I don’t own but it looks very interesting so I’m going to use it to show you how to analyze a stock from the bottom up.
In Qualtrim I start up at the top to make sure I like the high-level metrics before I spend my time looking into the specifics.

Their Profit margin is 53%. I’m happy with a 25% net margin & Visa shows double that! This is an early indicator that they have a significant competitive advantage in the payment processing industry.
Pair that with a 3.6% FCF yield & so far, things are looking good here with Visa stock.
Valuation isn’t such a slam dunk.
Because of their competitive advantage they trade at a premium to the market, & they should.
A 26 forward P/E isn’t the worst, but 14 times book is outrageous. I am going to have to pay up if you want to own Visa stock right now.
They’re cash to debt neutral, which is good, but their dividend yield is a paltry 0.81%. That’s half of the SP500 yield & in the realm of APPL & MSFT.
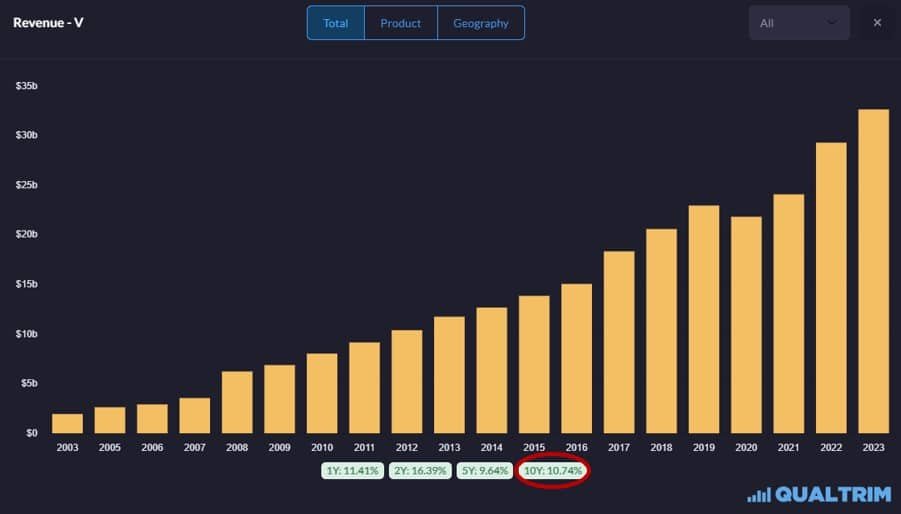
Revenue is increasing at 11%/yr.
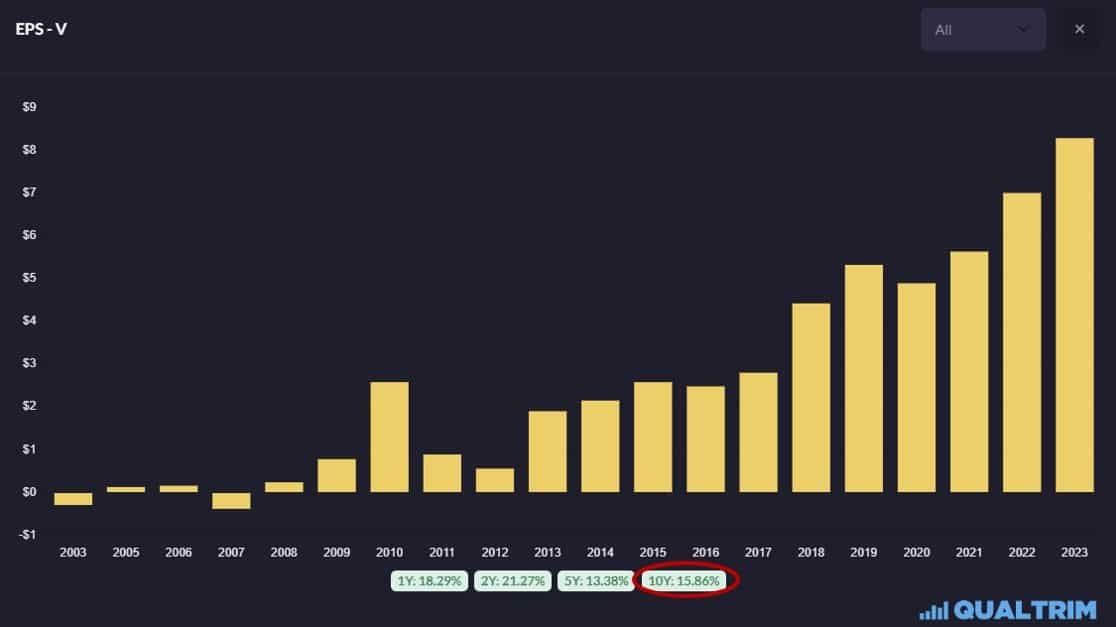
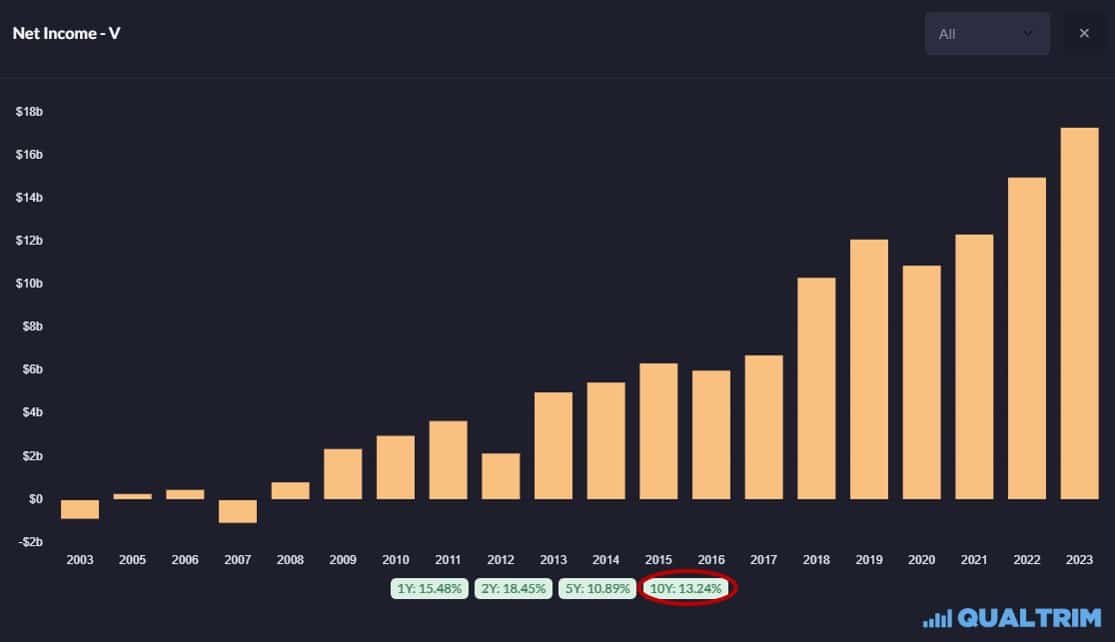
Net Income & EPS have also shown strong growth rates over the past 10 years.
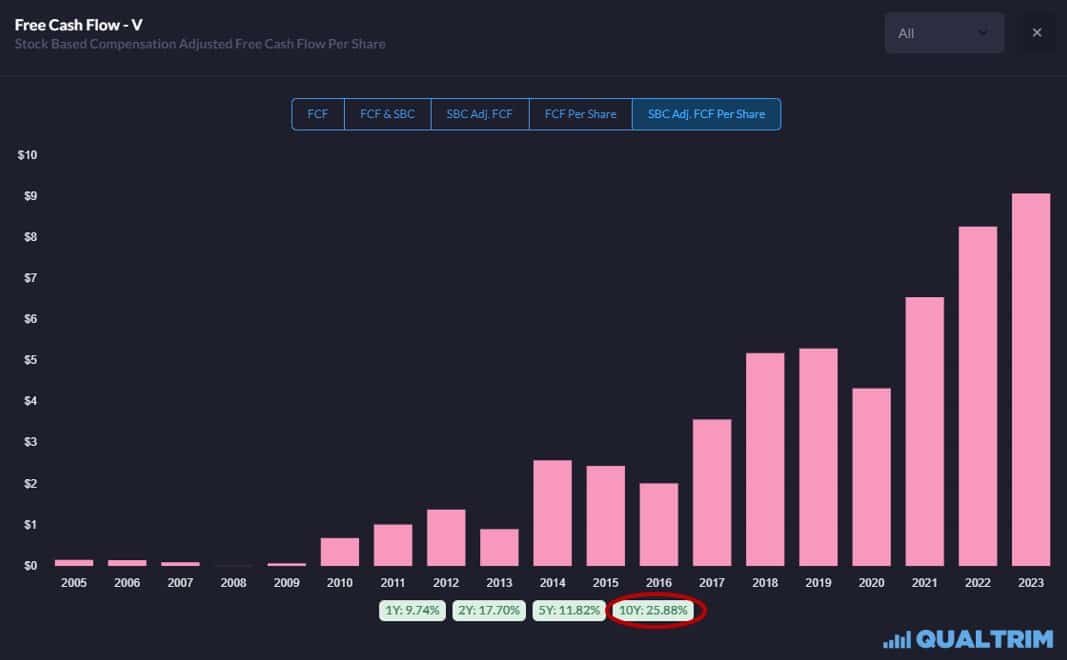
But the thing that makes me drool is that the FCF/share has been growing at a whopping 26%/yr. over the past 10 years. This is astronomical, & another indication that Visa has a strong business model with a durable competitive advantage. Having said that, it is important to observe that there is a little bit of cyclicality in their FCF. Nothing major, just something to be aware of.
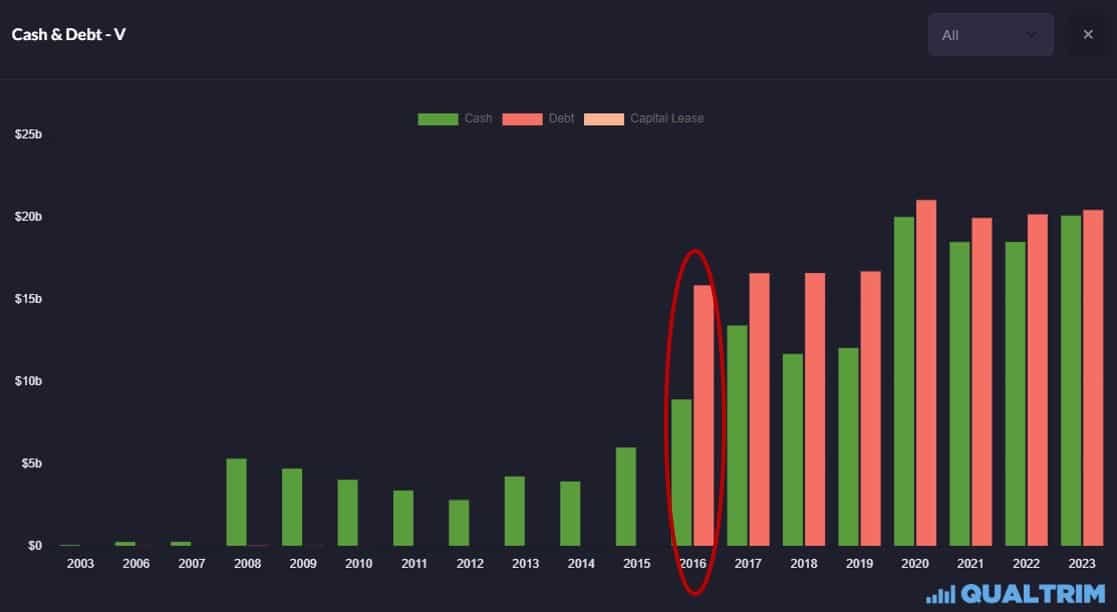
Although they’re pretty much in a neutral position in terms of cash on hand vs debt, I’m still wondering why they suddenly took on so much debt in 2016. We’ll have to look at the 2016 annual report for that information.
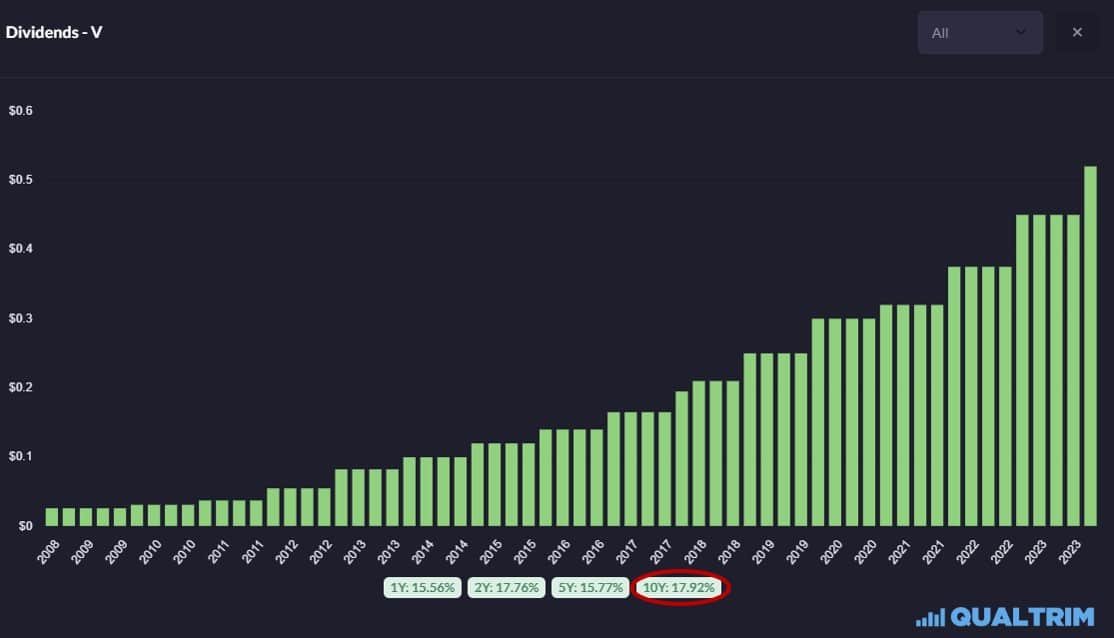
Dividends have been increasing at 18%/yr. for the past 10 years, & there have been no dividend cuts going back to 2008.
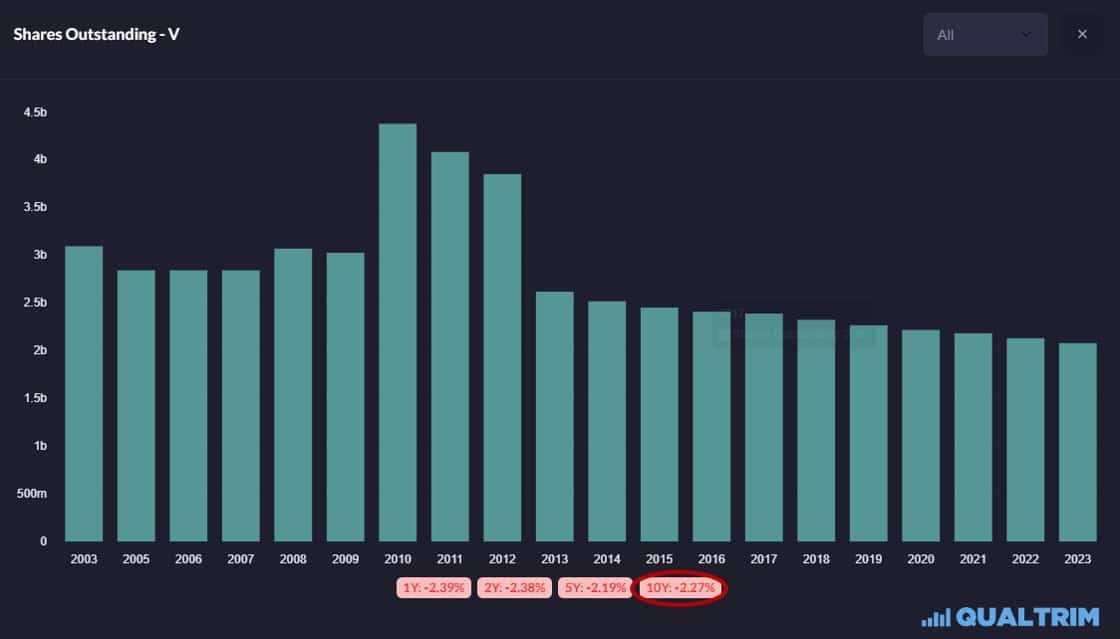
Shares outstanding are falling by 2%/yr. on avg, which is also nice.
Now let’s take a gander at the profitability metrics.
Besides FCF/share, Return on Invested Capital (ROIC) is the other metric that I put a lot of weight on. It basically shows you the average rate of return that a company generates when they invest back into their business.
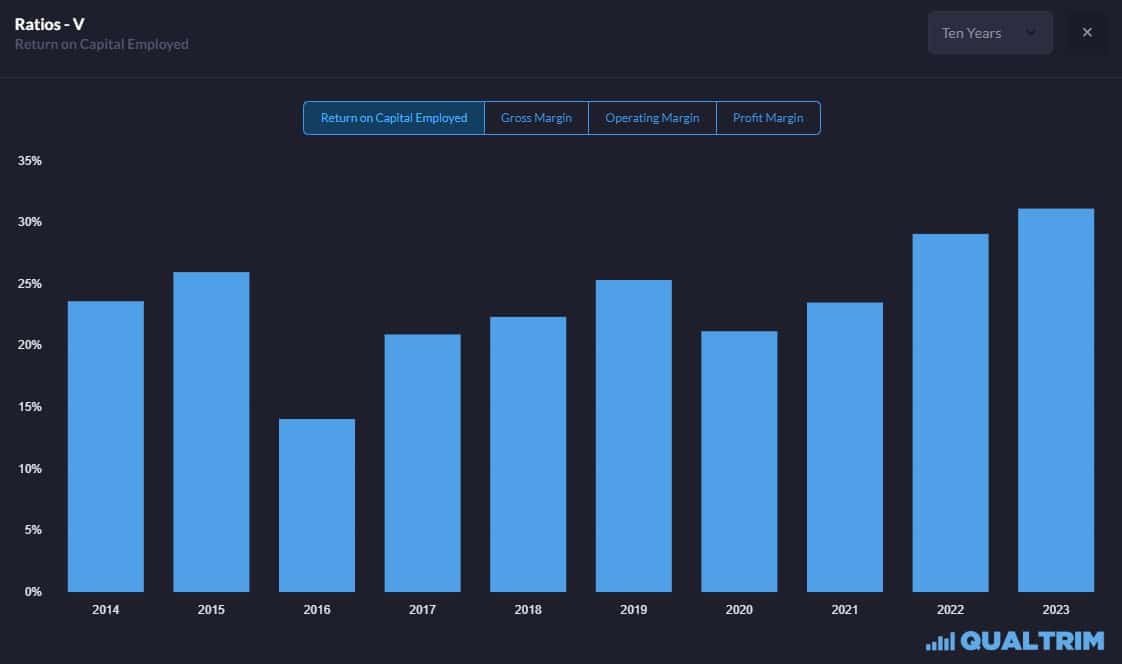
Visa runs in the 20-25% range which means that when they make an investment in the company, they generate a 20-25% return on average. Compare that to a weighted average cost of capital (WACC) of 7.5% at max & that means Visa is creating significant value for the Visa stockholders.
Eventually this value is reflected in higher revenues, higher profitability, more cash returned to shareholders, & ultimately, a higher Visa stock price.
Visa’s margins are solid.
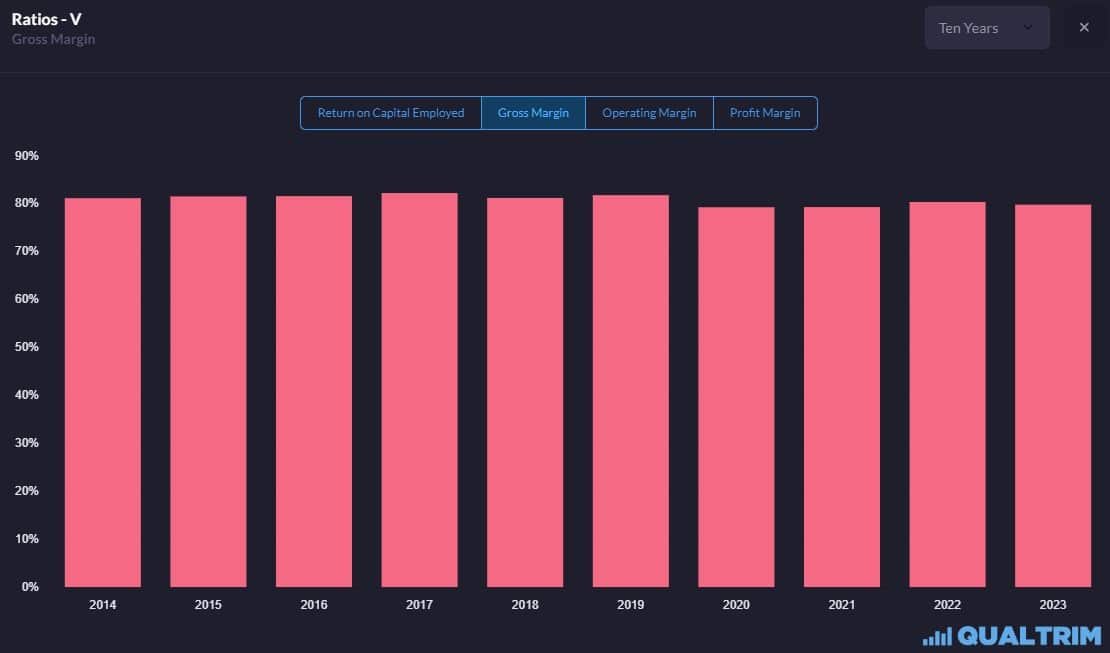
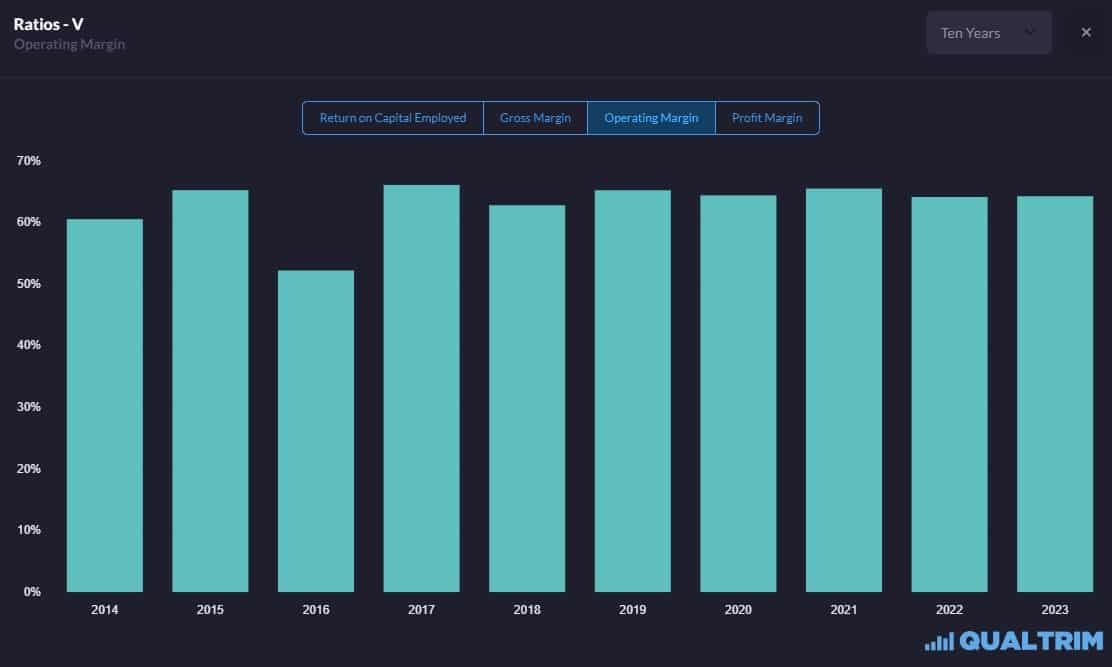
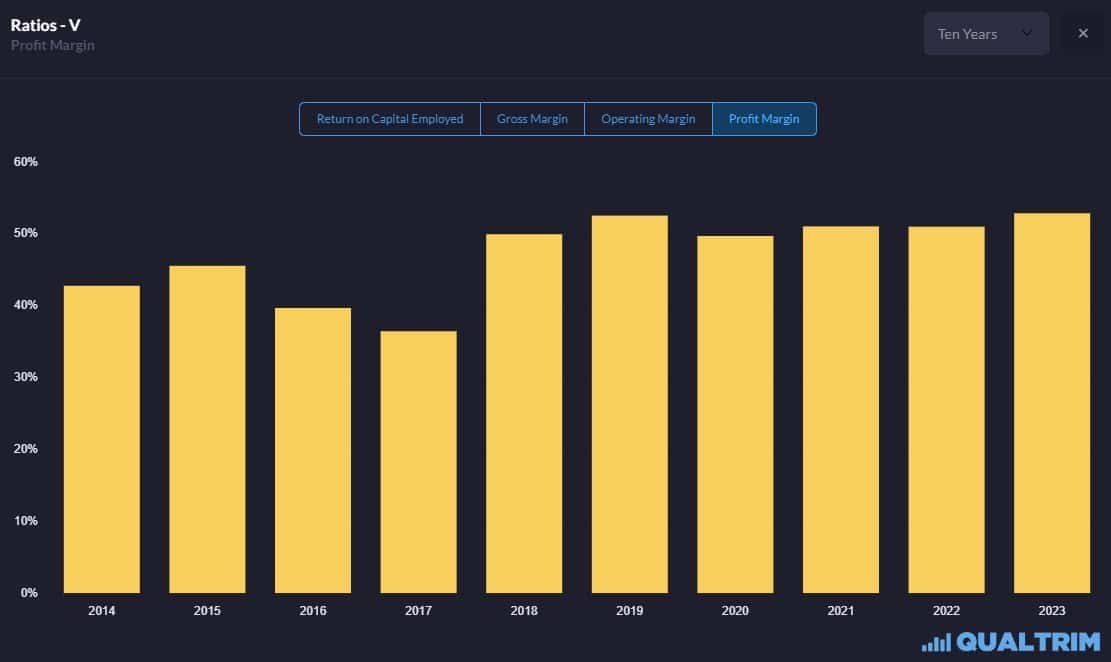
And the good news is that their margins have held up in the face of rising expenses. Over the past 18 years their expenses have tripled from approximately $3.3B to about $10.5B. The overwhelming driver of expenses is headcount, which has more than doubled since 2014. This is definitely a concern that I’ll keep my eye on should I decide to buy Visa stock.
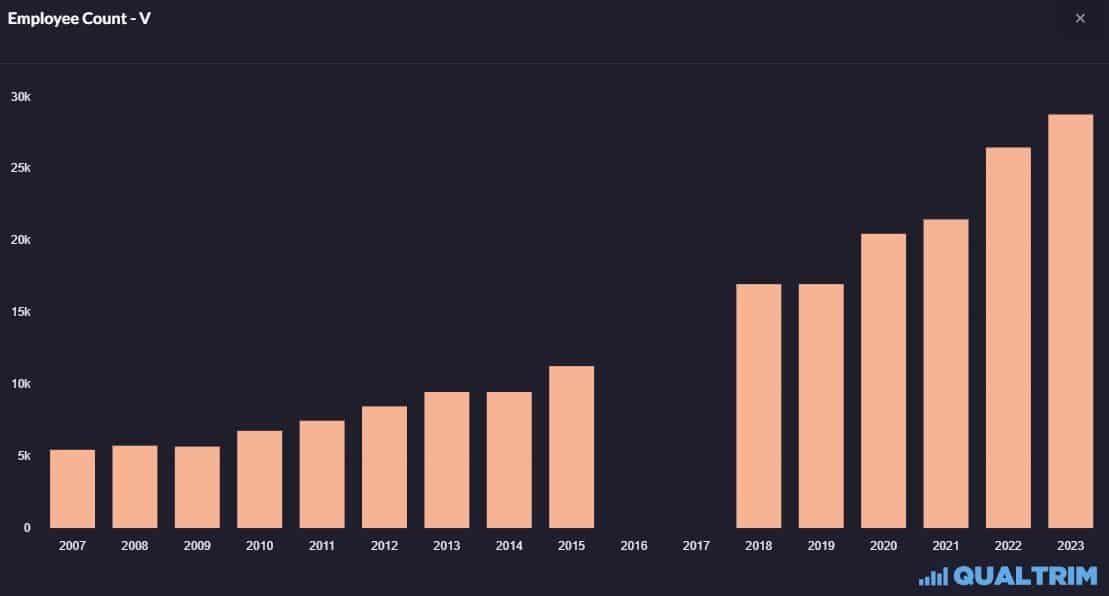
They’ve been able to keep all other expenses in relative check which has put a floor on their net margin at around 50%.
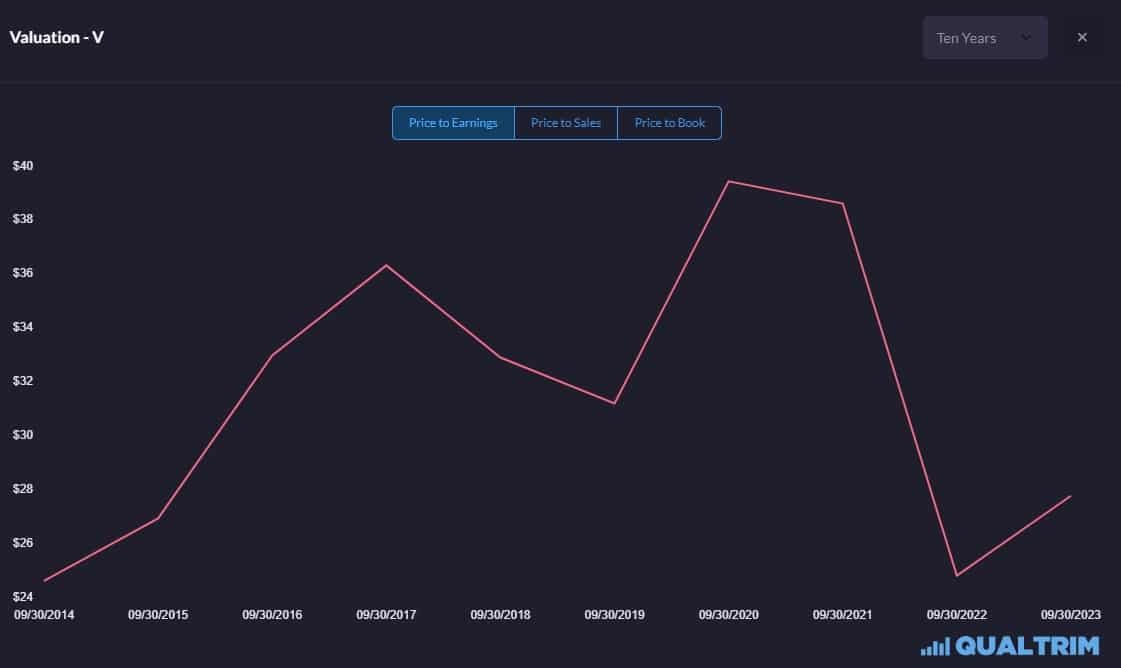
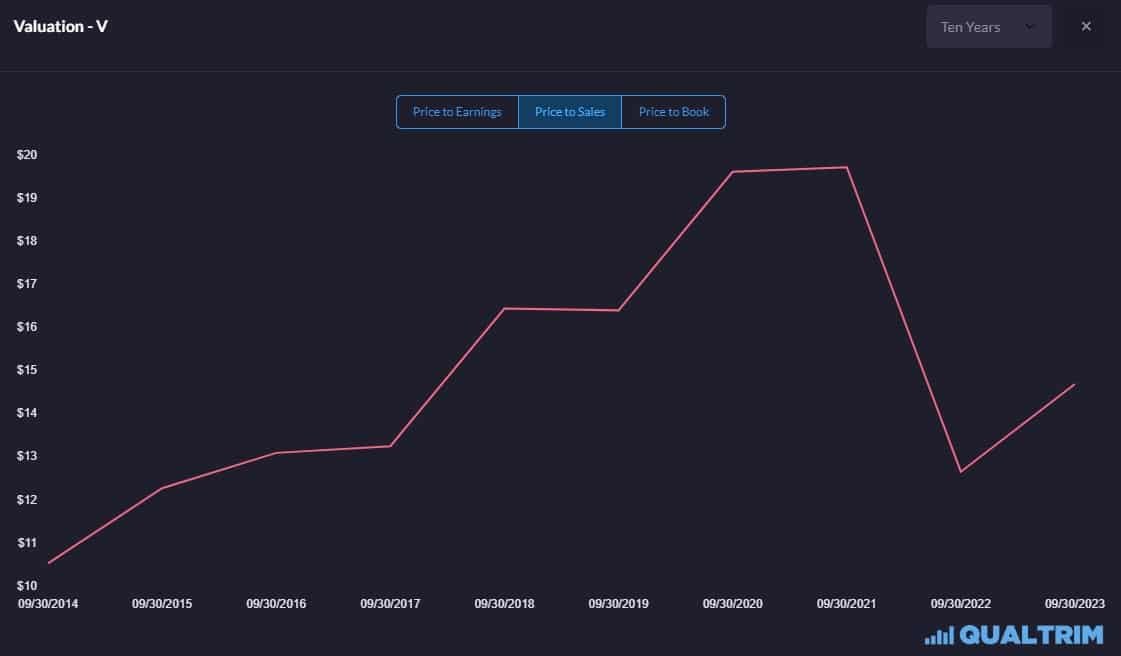
Finally, I like to look at the valuation trends to get an idea of if the stock is cheap, expensive, or in line with historical valuations.
On a P/E basis, it’s back to 2014 levels.
On a P/S basis it’s definitely more expensive than it has been in the past going from 11 in 2014 to 16 now.
But the P/B ratio is much more expensive than it ever has been going from 5 in 2014 up to 14 currently.
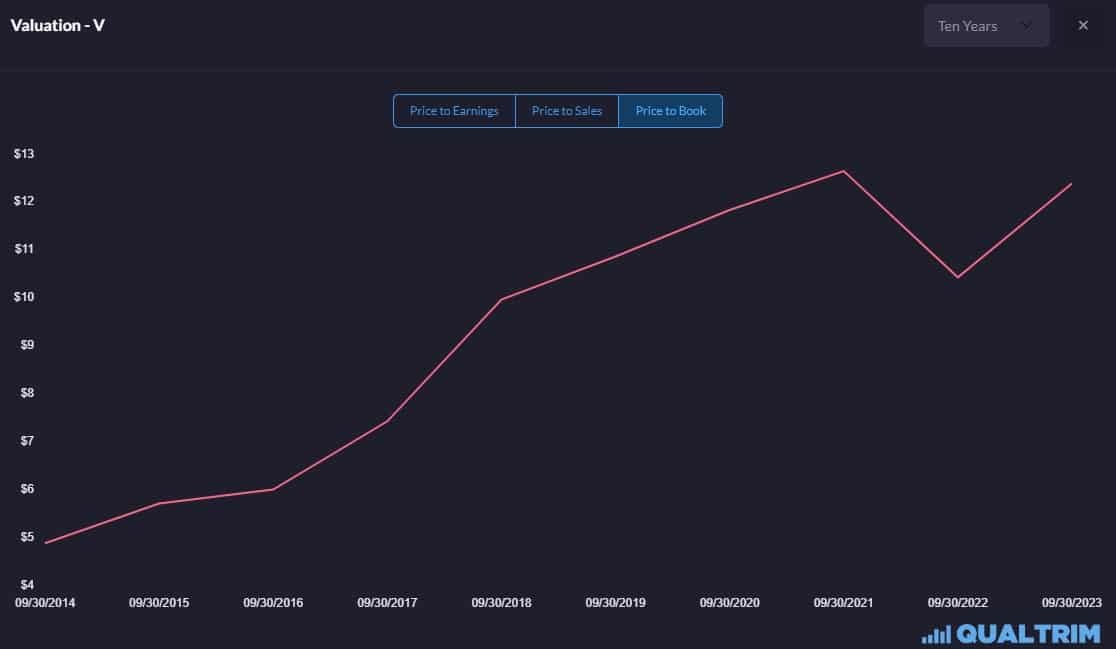
All-in all, Visa stock is definitely expensive, & I’d love to get it a bit cheaper. However, the P/E & P/FCF show that it is approximately in line with historical averages. The P/E & P/FCF are the two stock valuation metrics that I place the most weight on.
That’s it for the preliminary review. 8-9 out of 10 companies fail this initial screening for me. If I still like the stock, & I do here with Visa stock, I’ll do a more fundamental analysis of the financial statements.
Don't Fear the Financials
My basic approach here is to answer 3 questions:
- At was rate are the big, important metrics (Net income, Equity, Cash Flow) increasing/decreasing?
- Which line items are driving that increase/decrease?
- Is the current environment predictable & sustainable?
This is where we have to look at the components of the big, important metrics. For example, if Equity is going up, what is driving that? What is happening with the value of the assets of the company & what is happening with the value of the liabilities of the company?
Then we take it one step further & ask ok, if assets are increasing by $XB over the past 5 years, which asset line item(s) are driving that increase? Is it Cash? Accounts Receivable? Property, Plant & Equipment? Or maybe it’s due to a large increase in Intangible Assets.
You do the same for all the big, important metrics.
Whatever it is, we need to be the detectives that “peel back the layers of the onion” to get the answers about what is happening in the business.
Income Statement
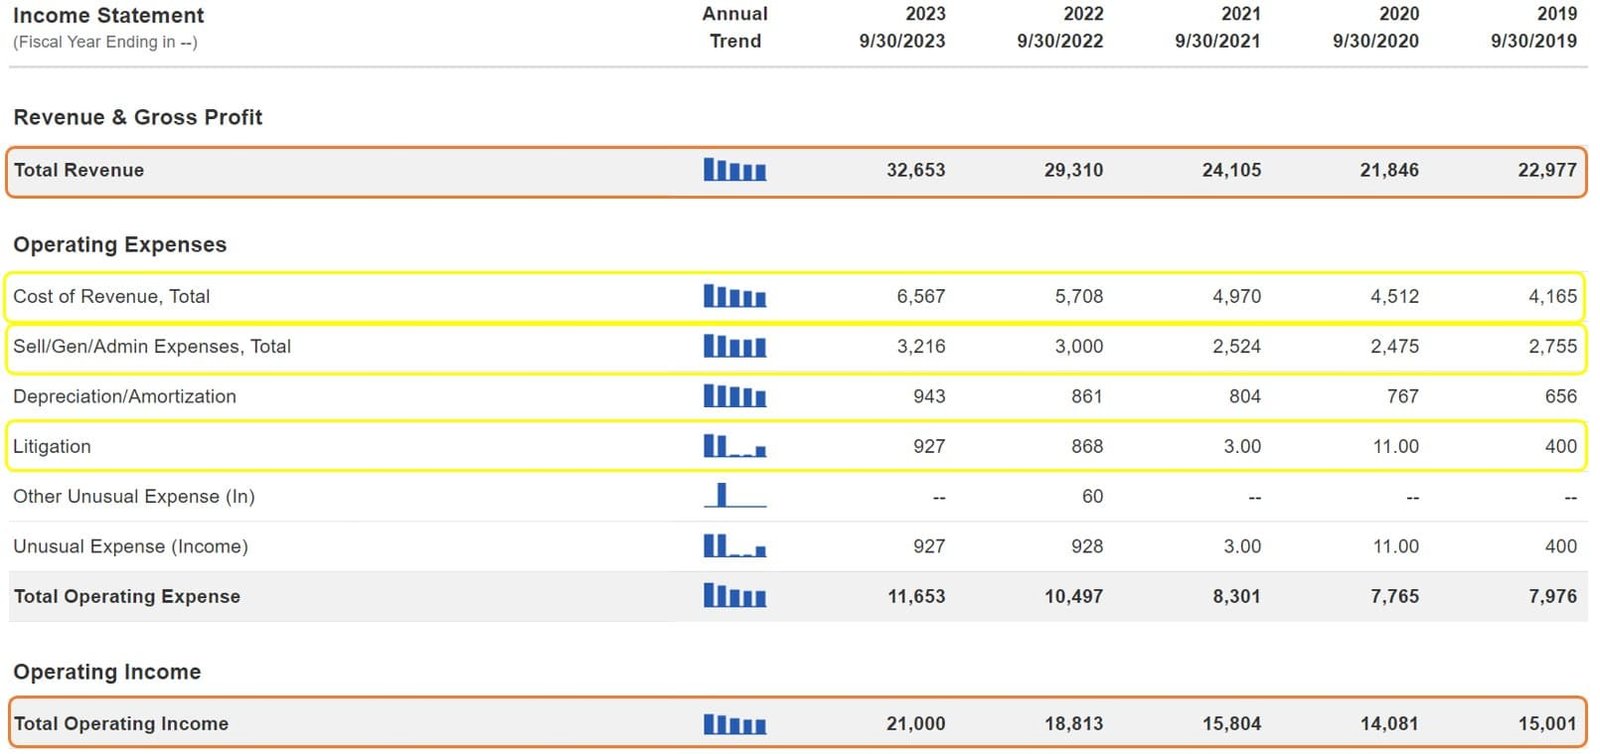
Visa’s Income Statement is pretty straight forward. Revenues are up ~$10B over the past 5 years (7.3% CAGR) while expenses have increased only $4B (7.9% CAGR). This has driven the considerable profitability & earnings expansion that we just saw in Qualtrim.
Cost of Revenue
This is a generic term for items such as Salaries & network processing fees. It’s the main drain on earnings, comprising 56% of Operating Expenses. Increasing at a 9.5% CAGR over the past 5 years, it has been driven by an increase in Headcount as well as a portion of what they refer to as “Client Incentives”.
Given that these costs of Revenue are the largest expenses for the company, & they’re increasing at a higher rate than Revenues, we need to keep an eye on them in the future.
Selling, General & Adminstrative
SG&A consists of marketing, consulting & other administrative fees. This is the 2nd largest expense comprising 28% of Operating Expenses.
Increasing at a 3.1% CAGR over the past 5 years, it has been driven by marketing & consulting expenses.
-
Litigation
As part of Visa’s “cost of doing business” are a somewhat large amount of litigation fees. Comprising 8% of Operating Expenses & growing at an 18.3% CAGR over the past 5 years, this is another item on the Income Statement that sticks out as an item to watch.
You may be wondering how I know what detailed expenses are included in each category. For this I use the SEC’s EDGAR database. Here you can search by the company name to get all of their regulatory filings with the SEC. They break out all kinds of information about the company, their financial statements, & the risks to the company in their quarterly (10-Q) & annual (10-K) reports.
Balance Sheet
At first sight, it’s a bit concerning that Shareholder Equity has stalled. Over the past 5 years it has grown at only 2.2%/yr.

However, this turns out to be a bit misleading because of this $2.5B “cumulative translation adjustment” at the end of 2022.
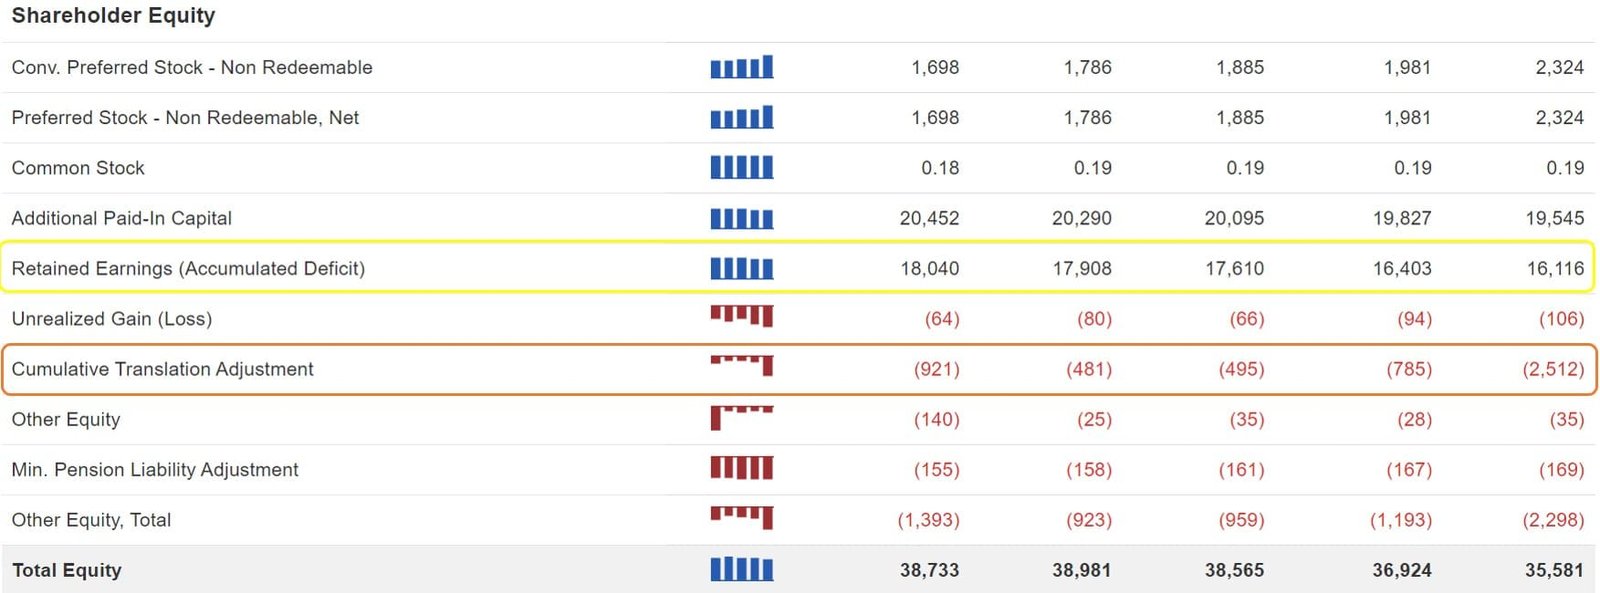
In the most recent annual report, you’ll find that these are foreign currency adjustments. You’ll also recognize that sometimes they’re positive & sometimes they’re negative. This depends on how the dollar is trading versus other currencies on foreign exchange markets.
Because this introduces “noise” into the underlying fundamentals of the company, it’s better to take a look at arguably the most important line within Shareholder Equity which is Retained Earnings. Retained Earnings has gone from $11B in 2018 up to $18B in the most recent quarter. That’s a 59% increase over the past 6 years. This equates to 8%/yr., a decent rate of growth to say the least.
Even though Retained Earnings are growing nicely, I still want to compare the change in assets to the change in liabilities to get a sense of how they’ve been managing their company over the past 5 years.
Assets have increased from $73B to $90B driven by an increase in Cash, Other Current Assets/Investments, Property, Plant, & Equipment & Other Long-Term Assets.
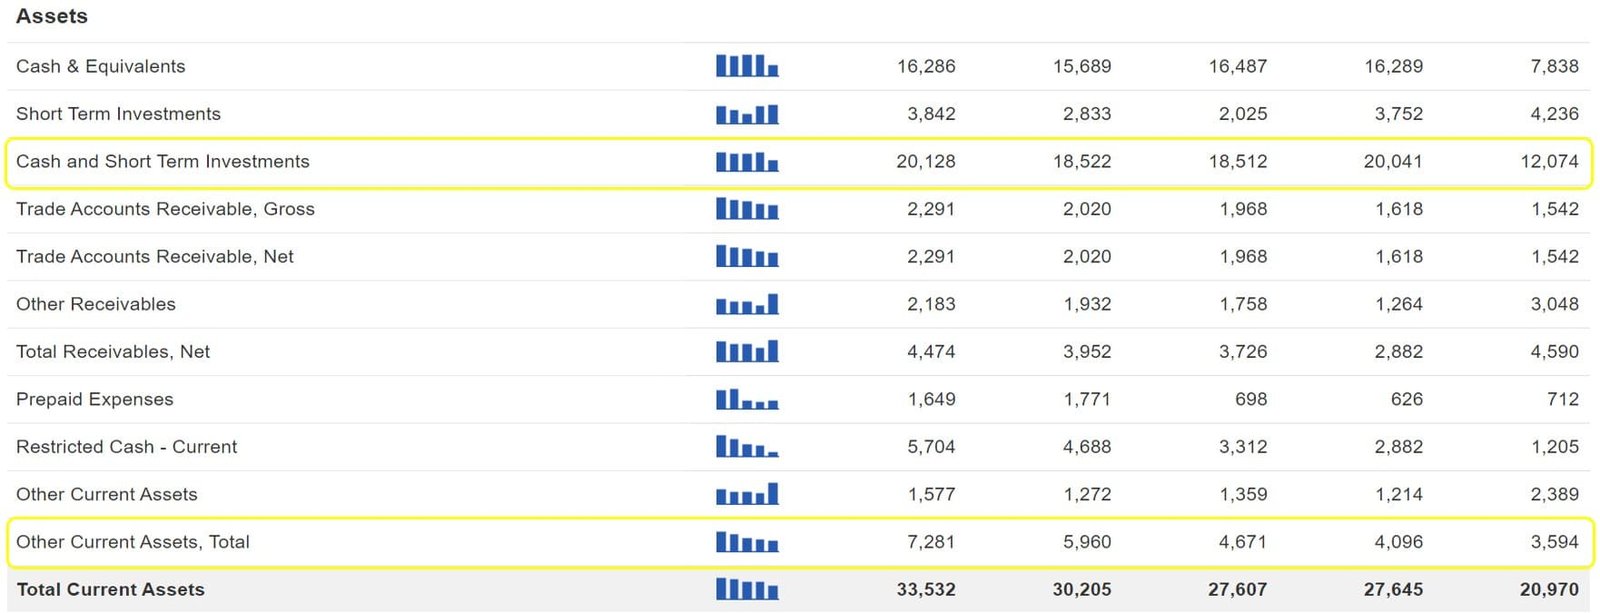
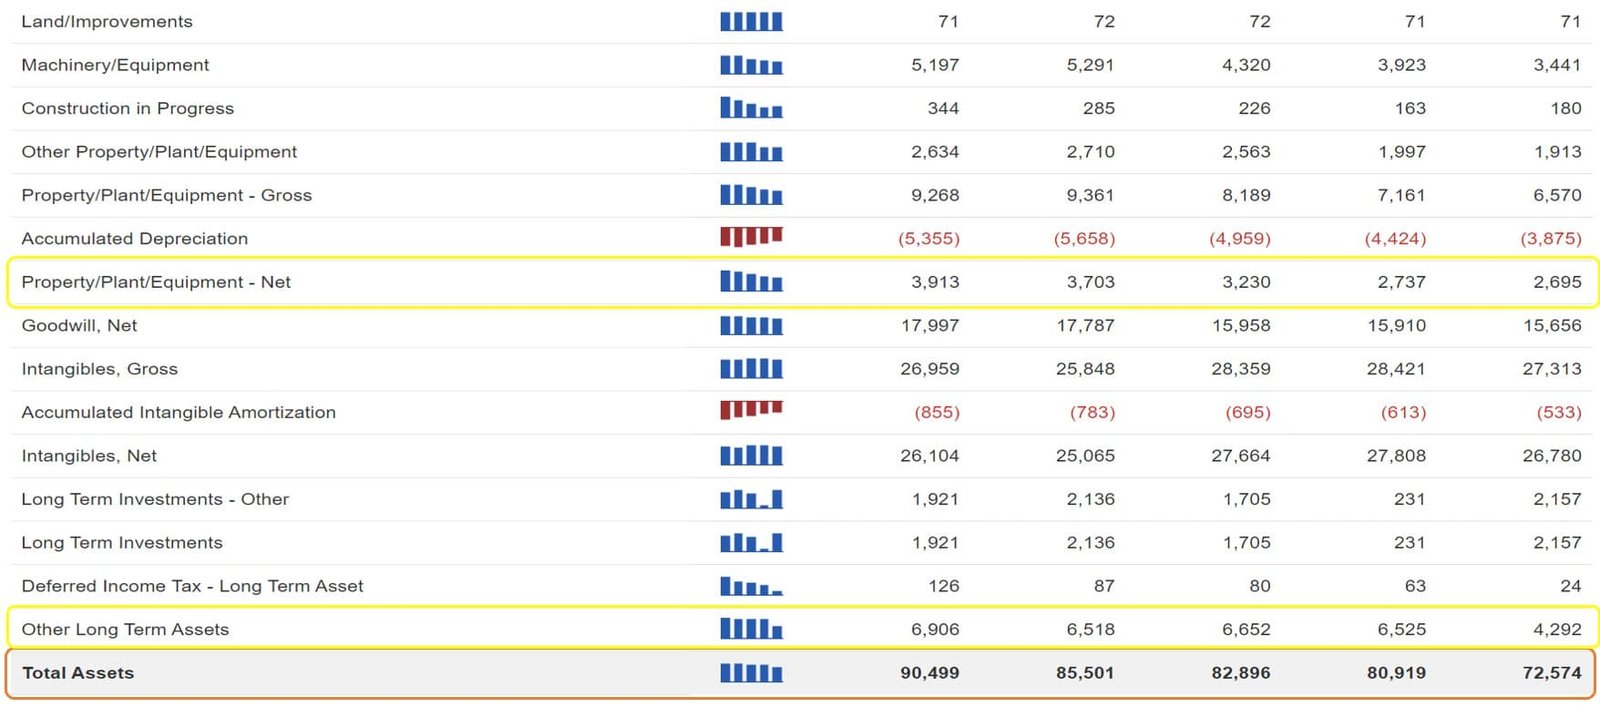
Half of these Other Long-Term Assets consists of growth in what they refer to as “Client Incentives”. Client Incentives are long-term contracts with other institutions & merchants designed to increase Visa’s payment volumes & product acceptance.
On the liabilities side, they’ve increased from $38B to $52B driven primarily by Long-term Debt, Accrued Expenses, & Other Current Liabilities. The Other Liabilities consists of Client Incentives which is the offset to the same line item on the asset side. Again, I figured that out by looking at the Annual Report.
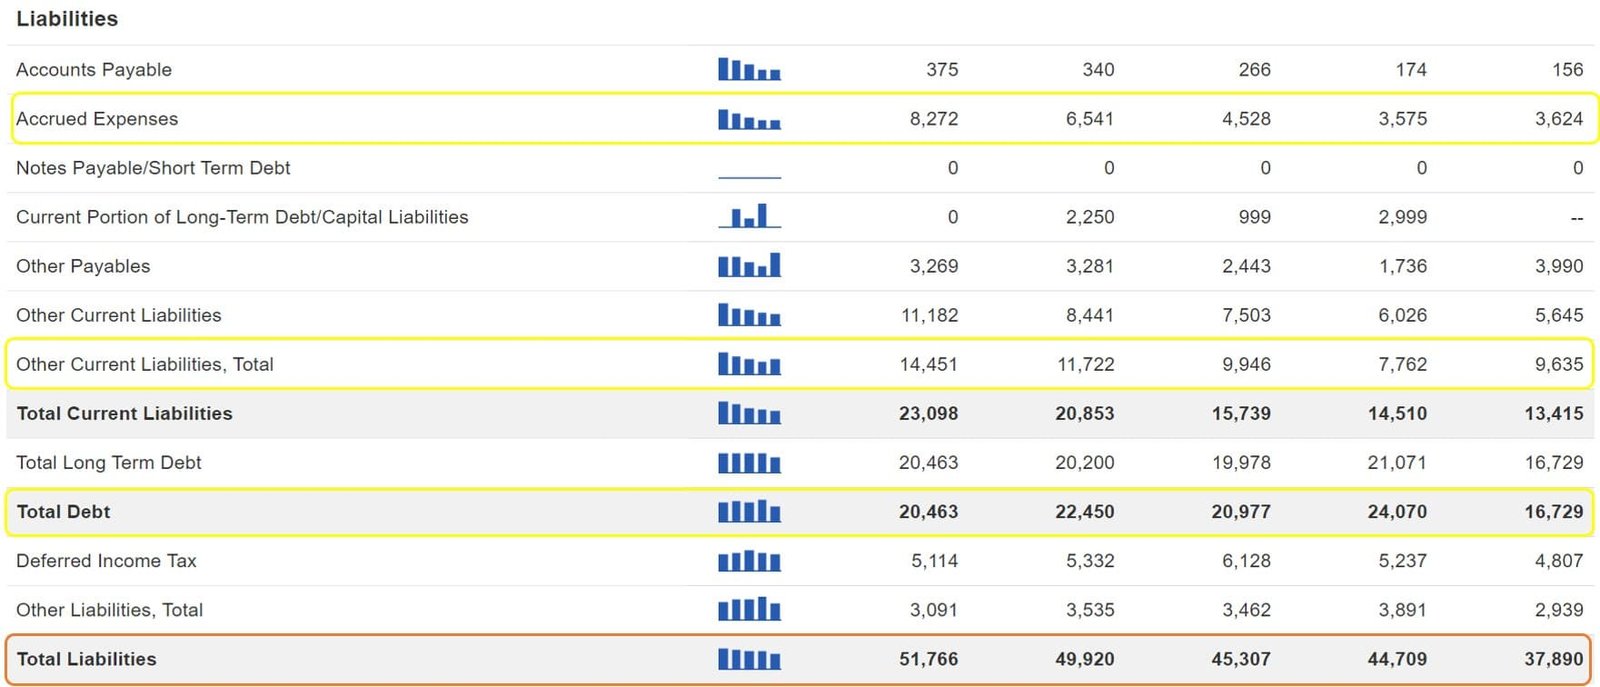
Accrued Expenses & Long-Term Debt are driving the increase in Visa’s labilities. Accrued Expenses are comprised of Compensation & Benefits (read stock-based compensation), Litigation Obligations & the largest component, Accrued Liabilities. These Liabilities consist primarily of lease agreements & gains/losses on foreign exchange derivative contracts.
Although I’d like to see the growth in these items slow & eventually go down, given Visa’s strong earnings & cash flow, they should have no problem at all paying those down. They could also collect on their receivables in order to pay them down.
You have to realize that in 2016 & 2020, when they took on more debt, interest rates were extremely low. Eventually they will have to roll over their debt. If interest rates stay elevated for many years to come, Visa will face significantly higher interest & debt servicing costs. This can hurt their profitability, share buybacks, dividend safety, & ultimately, their share price.
If you recall when we were looking at Qualtrim we saw that they literally had no debt until 2016. We wanted to know why they took on so much debt at that point in time. Pulling up the 2016 annual report & then finding the balance sheet, you’ll discover that they took on this debt to buy out the joint venture that it had with Visa Europe. Since then, their debt has increased from $16B to $20B due primarily to financing other acquisitions, buying back shares, & paying out dividends. You can determine all this directly from the annual report.
Although the debt remains very manageable given their profitability & excellent cash flow generation, I’d still like to see that debt start to get paid down over the next several years. If it keeps increasing, it will be a cause for concern for me.
Statement of Cash Flows
The final financial statement is the Statement of Cash Flows. Cash flow is arguably the most important metric & is considered the lifeblood of a company for 2 reasons:
The main way to artificially increase cash flows is to take on more & more debt. You can easily spot this by simply looking at the financing section of the Statement of Cash Flows.
With cash accounting you only record a sale as Revenue once you receive the cash. Accrual accounting, on the other hand, records a sale as Revenue at the time of the transaction.[2] This doesn’t mean you’ve received any cash yet because the product/service could have been bought on credit. The cash is expected to be paid at a later date. Therefore, the Revenue you just generated actually flows into Accounts Receivable, which is cash that still needs to be collected.
Here’s the problem. You can’t pay your bills or make investments with receivables. Those receivables do you no good when you need cash to fund your business. Sure, you can sell them to someone to raise some cash, but you’ll be taking a 10-20% haircut on the value of those receivables. In other words, the revenues that you booked are rarely your actual revenues when on an accrual accounting system. The true revenues are the cash received for your product or service. They could end up being 10-20% lower than the revenues officially reported.
Without cash flowing in, a company is screwed. It will have to take on more & more debt in order to finance its operations until it eventually goes bankrupt.
The Statement of Cash Flows is broken into 3 sections:
Cash Flow from Operating Activities
This shows you the cash that was generated by the day-to-day operations of the company. This is the main generator of cash for pretty much every business. At least it should be.
It’s most common to see Cash from Operating Activities as the main generator of cash for a company, with investing & financing activities being the drains on cash. If you come across a company that is consistently generating most of its cash through investing &/or financing activities this is a huge red flag.
If there is a lot of cash coming from investing activities it means that they’re selling their assets in order to fund its cash needs. Does that sound like a thriving business to you?
If there’s a lot of cash coming from financing activities, then it means that they’re either selling more shares of stock or they’re taking on more debt.
Neither of these situations are good signs for a company.
Looking at Visa’s cash from operating activities, you can see that it’s driven by Net Income, Non-Cash Items & Cash Taxes Paid, offset by a reduction in cash under “Other Assets”.
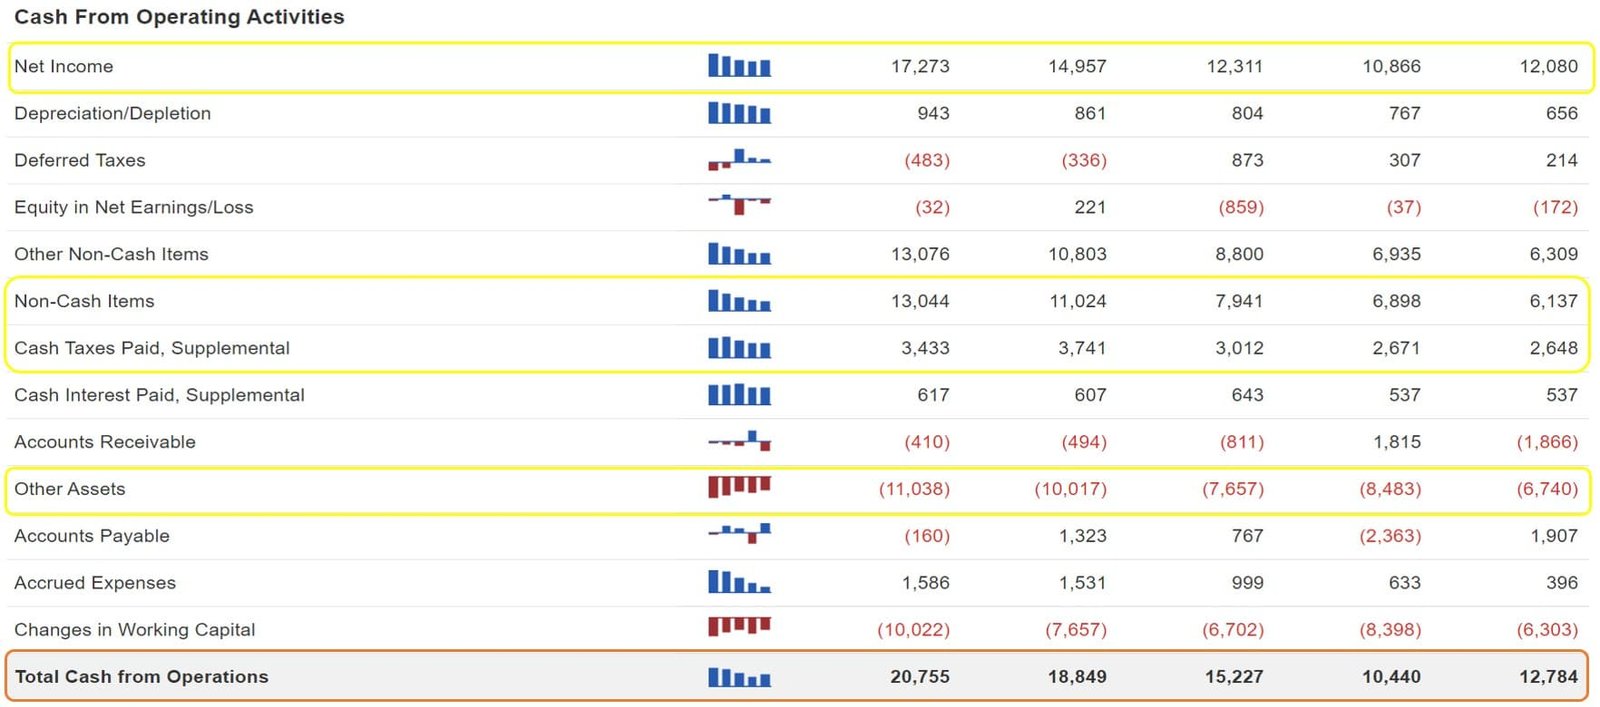
Given the sheer magnitude of the “Non-Cash Items” & “Other Assets”, two very vague terms, I pulled up the annual report to figure out what they are.
It turns out that they are different sides of this “Client Incentives” thing that Visa is involved in to try to grow their business. As you can see, these two line items pretty much offset each other every year. Therefore, we can ignore these two line items for this analysis but we’d want to keep an eye on them each quarter.
It also turns out that the “Cash Taxes Paid” are a subset of the “Other Non-Cash Items” & Schwab is just providing this breakout for informational purposes. You can ignore this line item. This leaves us with Net income as the overwhelming driver of cash flow from operating activities. Exactly what we want to see.
Cash Flow from Investing Activities
The main drivers in this section are Capital Expenditures, Acquisition of Businesses, & the sale & purchase of investments. You may also notice that the only time that cash flow from investing is highly negative is when they either buy another business or they purchase more investments than they sell/that matures.

All of these are common for any large corporation, so everything checks out here.
One thing that Warren Buffett mentions as an important part of a good business is that they don’t spend a large portion of their revenues on Capital Expenditures or other costs that are absolutely required to maintain their competitive advantage. Depending on the type of company, this could include things like capital expenditures, research & development, marketing & advertising etc.
When I get to this section, I like to calculate this % to make sure it’s not too high. Dividing the Capital Expenditures line (Statement of Cash Flows) by Revenue (Income Statement), it turns out that Visa only spends 3% of their Revenues on Capital Expenditures.
However, Visa is involved with something they call “Client Incentives”. This is a type of kickback scheme that they offer to institutions & merchants to incentivize them to use Visa’s network. If Visa were to get rid of this, their market share would most likely fall significantly. How much? Not sure, but there is a reason they pay billions of dollars of incentives so the benefit must be much larger than that.
If I include that in this calculation, Visa’s “fixed” costs would comprise 30% of their revenues! This is not good.
Having said that, Visa’s revenues & free cash flow consistently grow much faster than Client Incentives. So, at this time it’s not something to worry about. Rather, it’s something to keep a very close eye on.
Cash Flow from Financing Activities
The Repurchase of Common Stock & Dividends Paid are the primary drain on the company’s cash flow in the Financing Activities section.
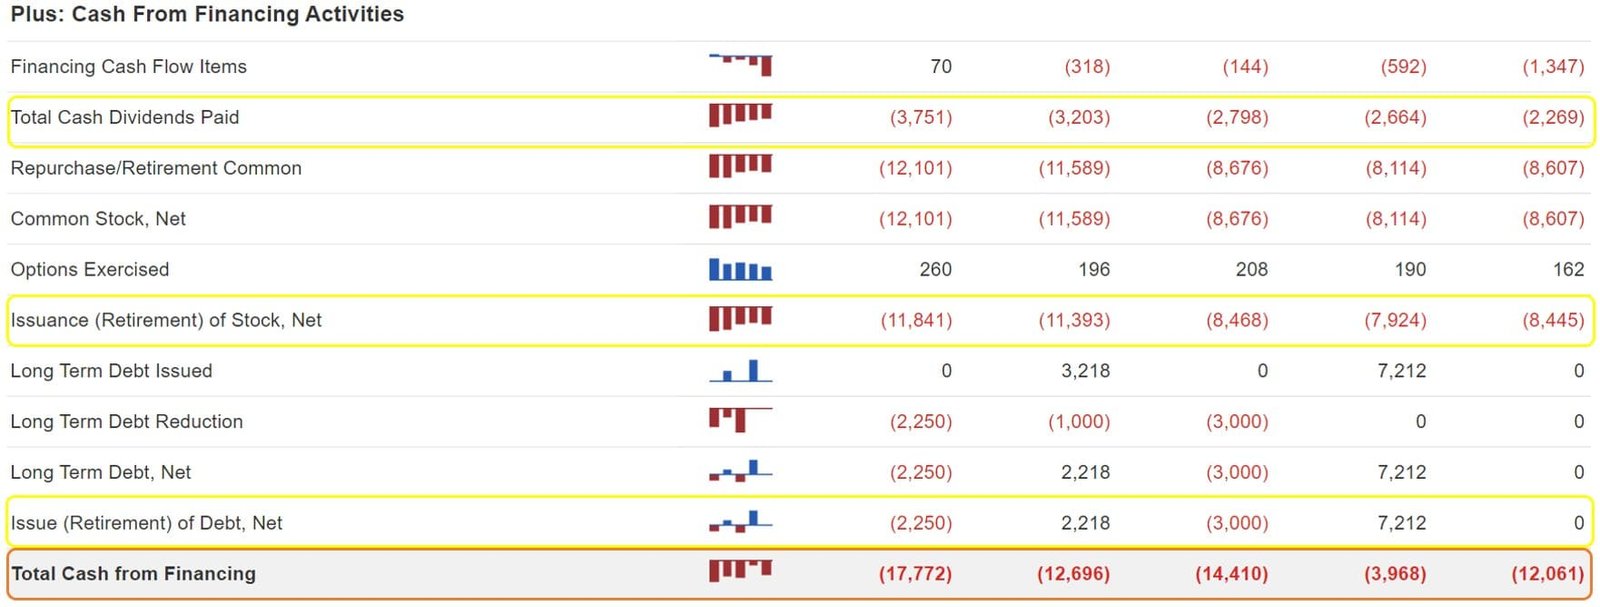
You’ll also notice that they’ve been taking on debt. As I mentioned earlier, debt is one way to inflate the cash flow of a company. This is because you’re receiving cash when you take out a loan. In the Annual Report Visa states that the $7B (2020) & $3B (2022) of debt issued is for “general corporate purposes”. This is very vague but from the looks of it, they’re using the debt to buy back Visa stock.
This may have been a smart business decision the past few years when they could issue debt at 2-3% but with interest rates rising, this arbitrage opportunity is much less profitable. Because of this, I’d expect buybacks to drop down to more normal levels over the next year or two. This means that we may see less of a benefit on EPS due to buybacks going forward.
Crush The Competition
The next step is to compare their metrics to their competitors.
I do this so that I get some industry benchmarks to compare against. If a company’s metrics are outstanding like Visa’s are, but so are all of their competitors, then this suggests that the economics of the industry may be driving their results rather than the company having a durable competitive advantage.
There have been times that I think I like a company, then I compare them to their competitors & I discover that I actually like one of their competitors even better.
Once again, I use Schwab.com for this so let’s jump back over there to do the fundamental analysis.
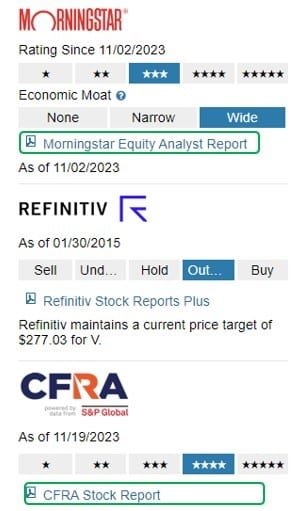
The first thing I do is pull up the Morningstar equity analyst report which is free with a Schwab account. Here you’ll find a list of their competitors.
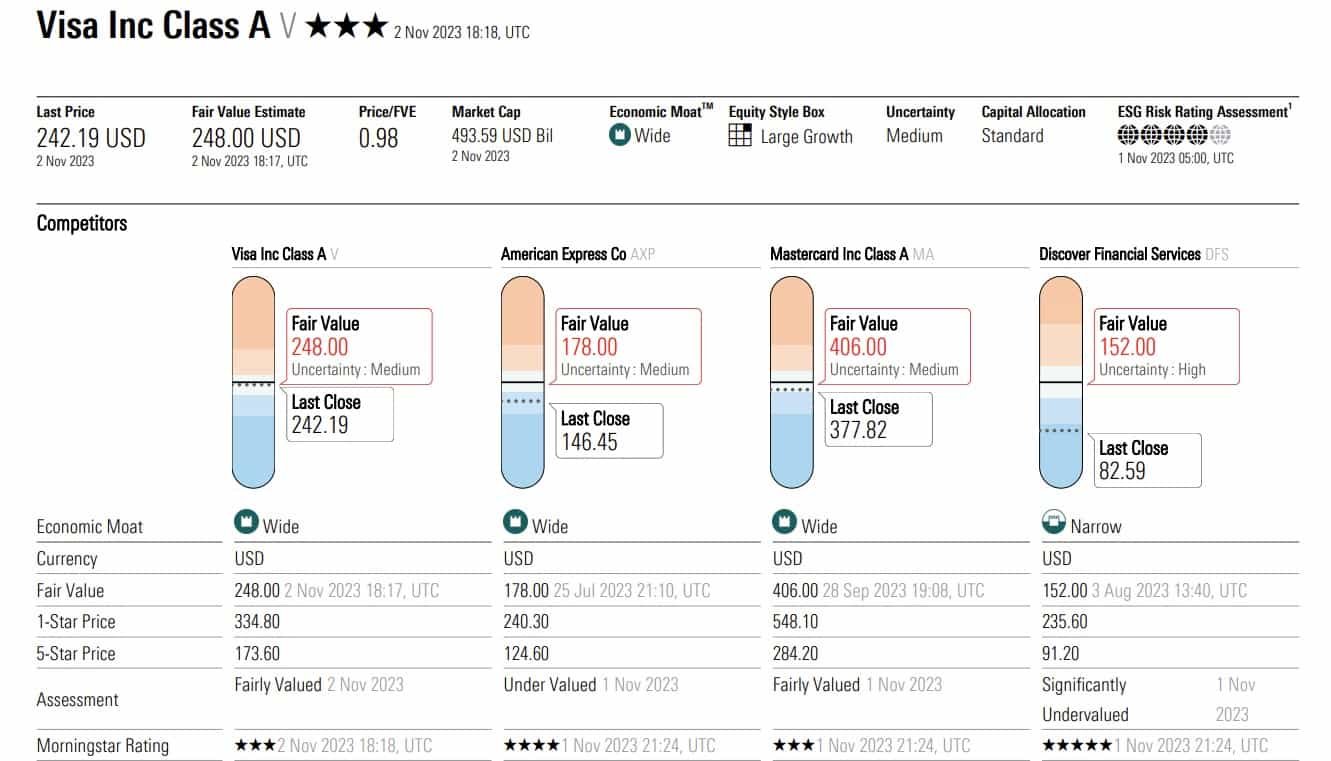
Next, go to the Competitor Comparison Tool & enter the ticker symbols of their competitors.
In the fundamentals section you’ll see that their profit margins are the best of the group. They have very good ROE & ROIC with much less of a debt load than their competitors. This is another indication of a monopoly or duopoly type competitive advantage.

As far as valuation goes, it’s apparent that Visa & Mastercard are very expensive relative to AMEX & Discover. The primary reasons for this are that their profitability & growth prospects are much higher than those of the other 2 companies.
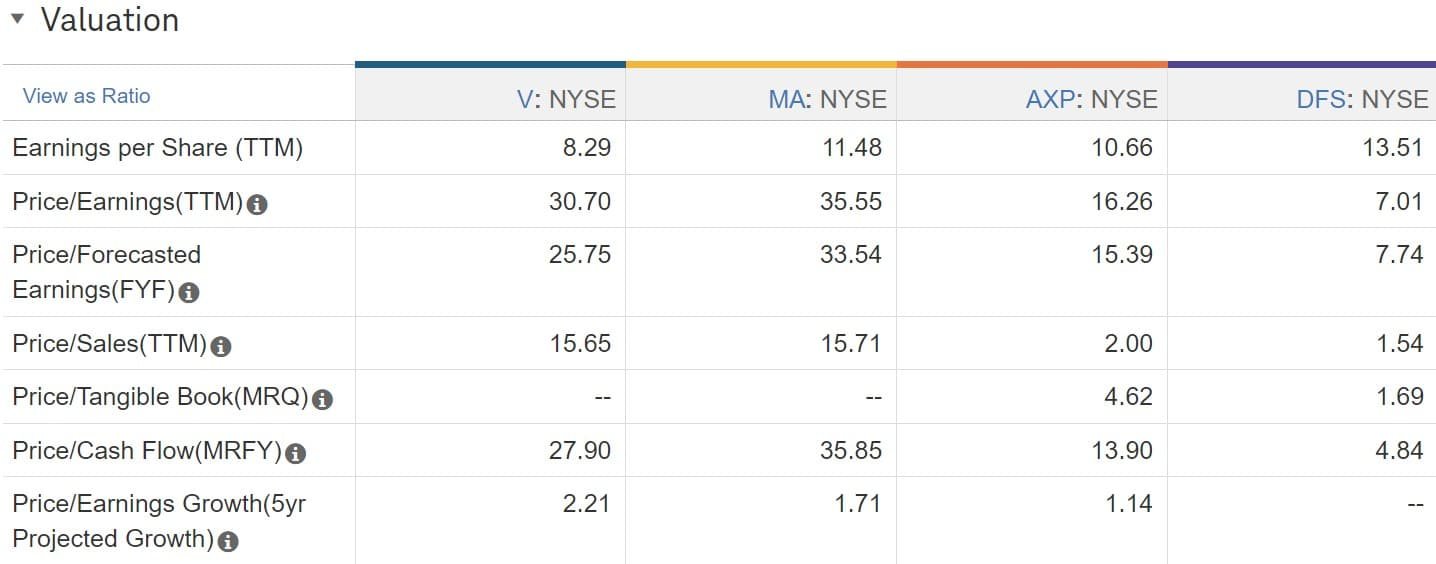
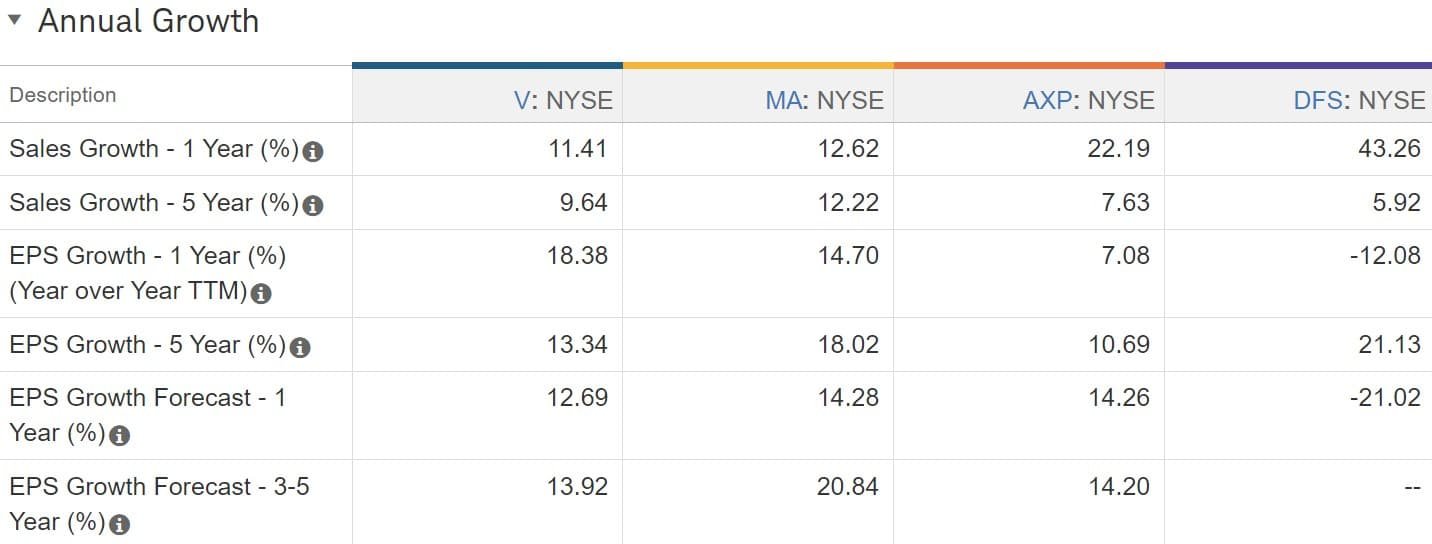
For example, AMEX’s EPS has been growing at approximately ½ the rate of Visa’s over the past 5 yrs.
Also, I just don’t like companies that generate only a 13% net margin & 8% ROIC. I can get a better company, generating 53% profit margins & 26% ROIC. I’m usually going to pay the higher price for the company that is more profitable provided the valuation is reasonable.
The dividends of all these companies look very safe with payout ratios around 20% & coverage ratios of 400-500%.
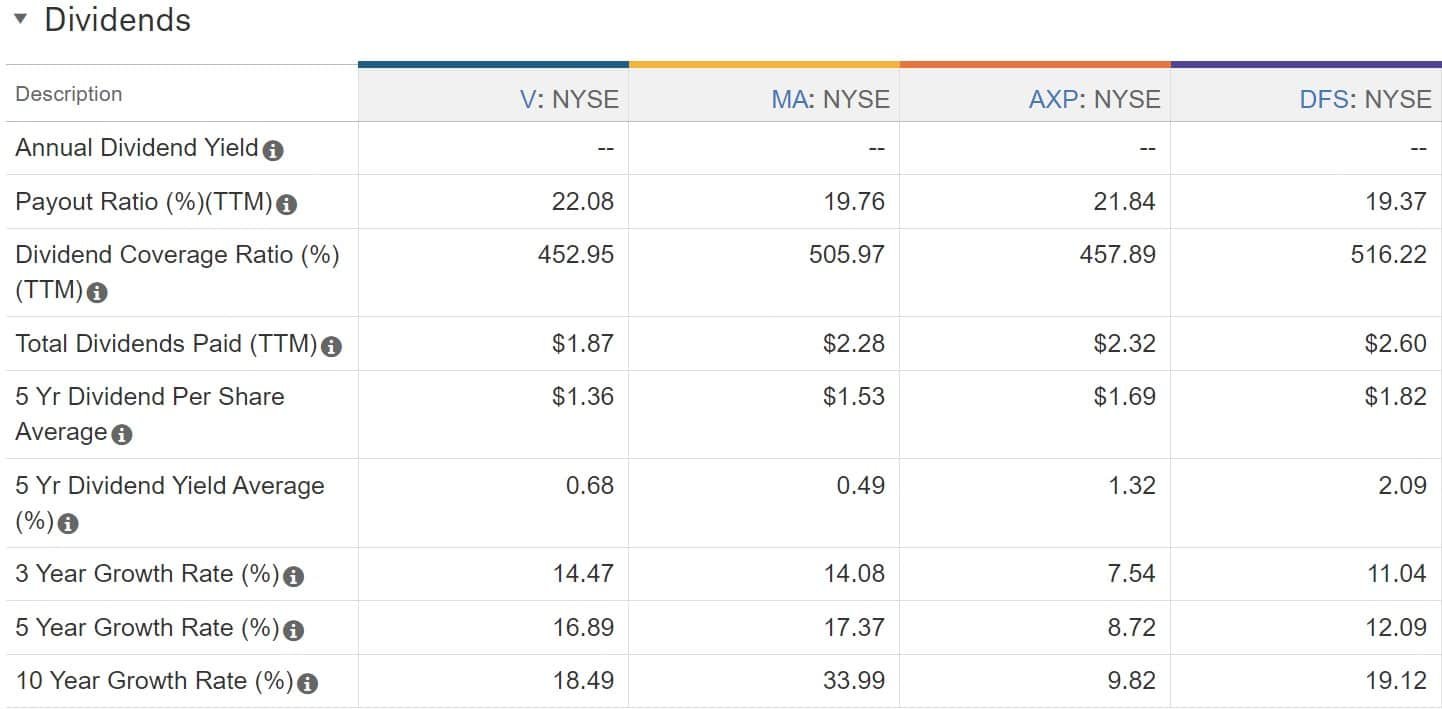
The only one that pays a reasonable dividend is Discover & this is because they’re primarily a bank first & a credit card company second. Sure, I’d prefer that Visa stock pays a 2-3% dividend, but my primary objective is to invest in companies that grow quickly & have a strong competitive advantage as these are the companies whose share price outperforms the market over the long term.
A large dividend is more of a nice to have for me when it comes to analyzing a stock.
Your approach may differ. In that case Discover appears to be a fine company that is going through a pretty significant dip right now. This could be a great buying opportunity for a good company that pays a nice dividend. I haven’t done my full research on the company yet so I can’t say for sure, but it definitely appears to be a great buy right now.
Moving on to profitability. This is where Visa shines. They’re ahead of their competitors on all these profitability metrics.
And then you can see that Visa is generating superior profitability & growth prospects while using much less debt relative to their equity. As I’ve mentioned a couple times already, this is something I strongly weigh in my decision making. With interest rates expected to stay at these elevated levels, a lower debt load should be a nice tailwind for the future.
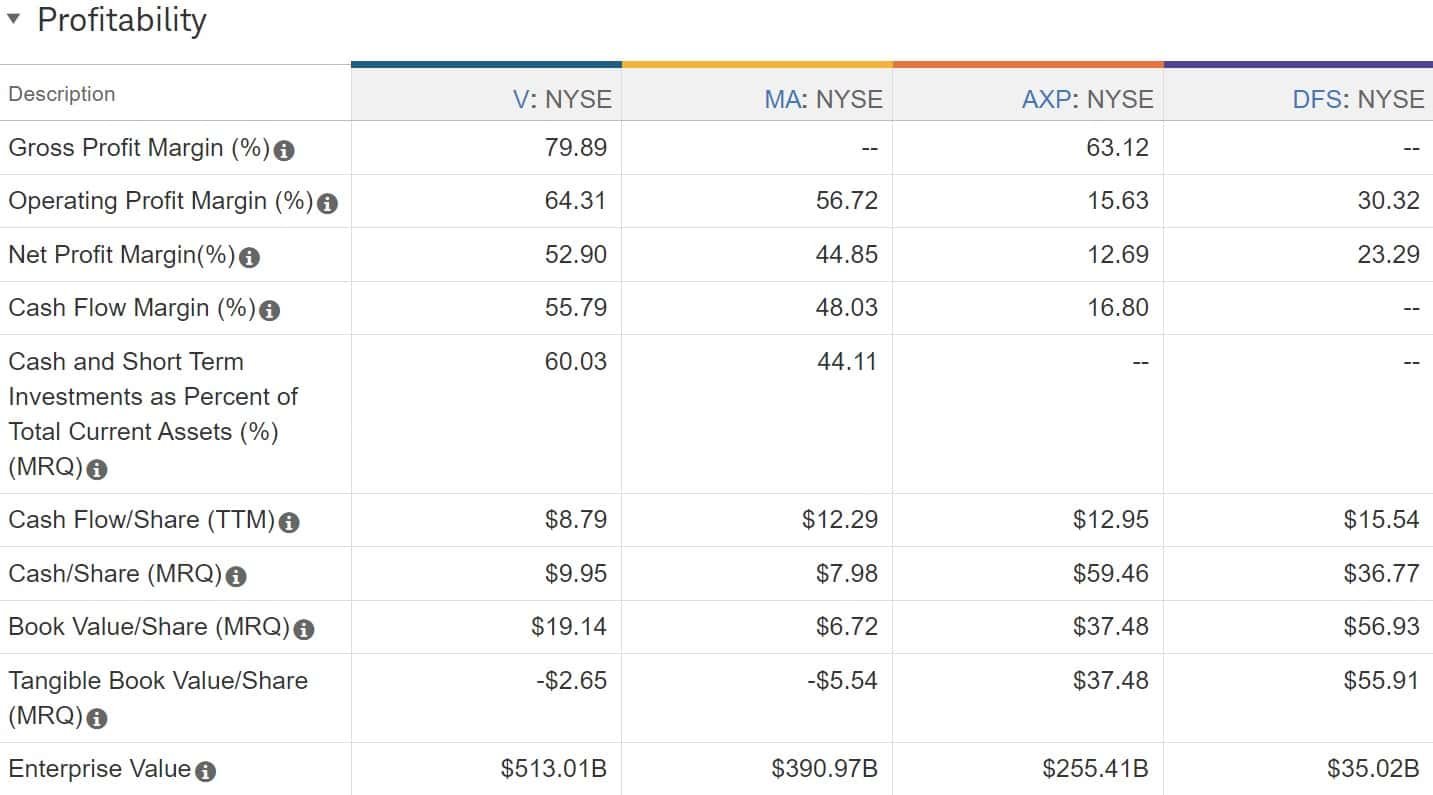
You may notice that both Visa & Mastercard have a negative tangible book value per share. This means that their goodwill & intangible assets, such as their brand & their payment processing network, are valued on their balance sheet at more than their equity is.
I usually want a company to be able to absorb their intangible assets going to 0. I consider this just another cushion built into the value of the company. But when you’re talking about brands like Visa, which has a global reach & is used by hundreds of millions, if not billions of people every day, their intangible assets deserve to be valued highly.
Goodwill is another story. Goodwill is the overpayment for businesses that they’ve acquired. If the market value of a business is less than what they paid for it, then they carry the overpayment as an asset on the balance sheet. This is nonsense in my opinion. If you paid too much for something, it should be recognized as a loss. Then the amount of the loss could be adjusted annually based on the most recent market value of the asset. It’s like me or you being able to carry the difference between what we paid for a car & what we can sell it for as an asset on our balance sheet.
Unlike a brand, patents or other intangible assets that are very important for a company’s competitive advantage, Goodwill is a phantom asset. It does absolutely nothing to help a company compete. I will never buy a company that holds more goodwill on their balance sheet than what they have in equity. Visa holds a ton of goodwill but it’s less than ½ the equity on the balance sheet, so I’ll let it slide. However, the combination of goodwill & the legitimate intangible assets is greater than the value of the equity. This is why they show a negative tangible book value.
That wraps up the quantitative portion of analyzing stocks. If a company passes the initial screening, the high-level review in Qualtrim & it’s still a potential investment after combing through the financials, it’s time to dive into qualitative portion of analyzing stocks.
Qualitative is Just as Important as Quantitative
This is where I dig into the story of the company & start learning about all the aspects of the company that you can’t learn from the financials. Just like I have questions I want to answer when it comes to the review of the financials, I have questions that I want to answer when it comes to the qualitative aspects of the company.
- How does the company make money?
- Is the company positioned for growth & profitability?
- What are the company’s competitive advantages?
- How is the industry doing as a whole?
- What are the risks/challenges facing the company?
I start with the Morningstar equity analyst report because it gives great information about their view of the company’s competitive positioning, earnings, risks, & a fair value estimate. Next, I move to the CFRA report that is also free with a Schwab account. This gives me a second perspective of the company & another valuation that I can compare to Morningstar’s fair value estimate.
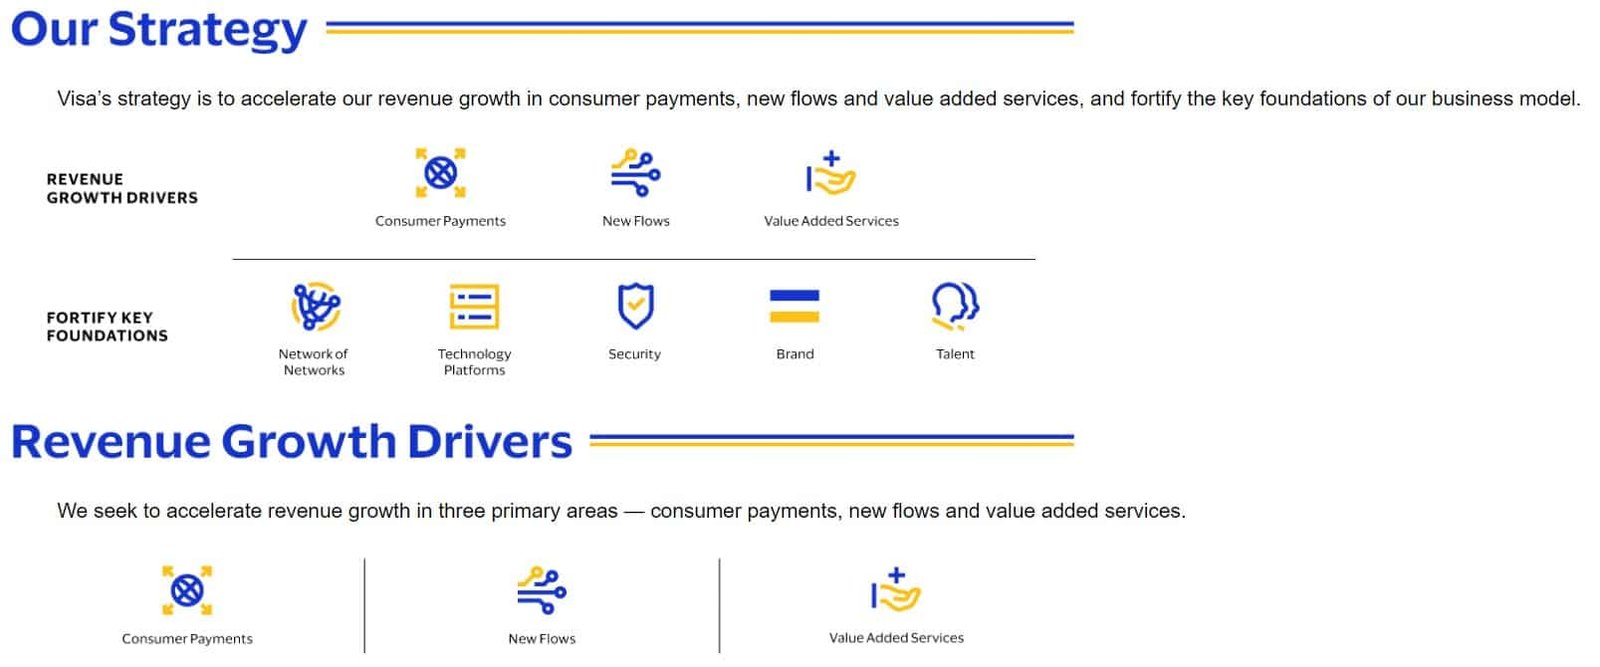
Finally, I go to the most recent annual report where I primarily focus on the business overview section. This gives deep, invaluable information about the company from the perspective of those who actually run the company. This is where you get to learn about the company’s strategy, their clients, the solutions that the company offers to their clients, their sales & marketing strategy, who their competitors are & how they compete with them, & of course, a long list of risks.
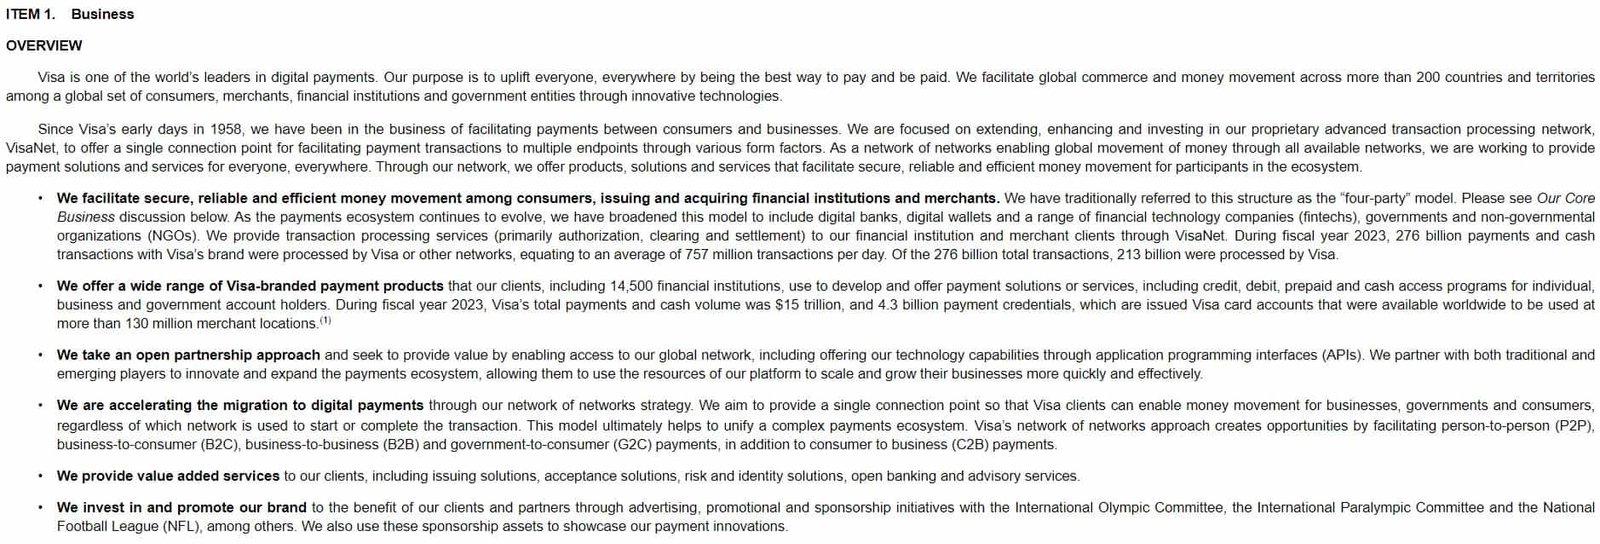
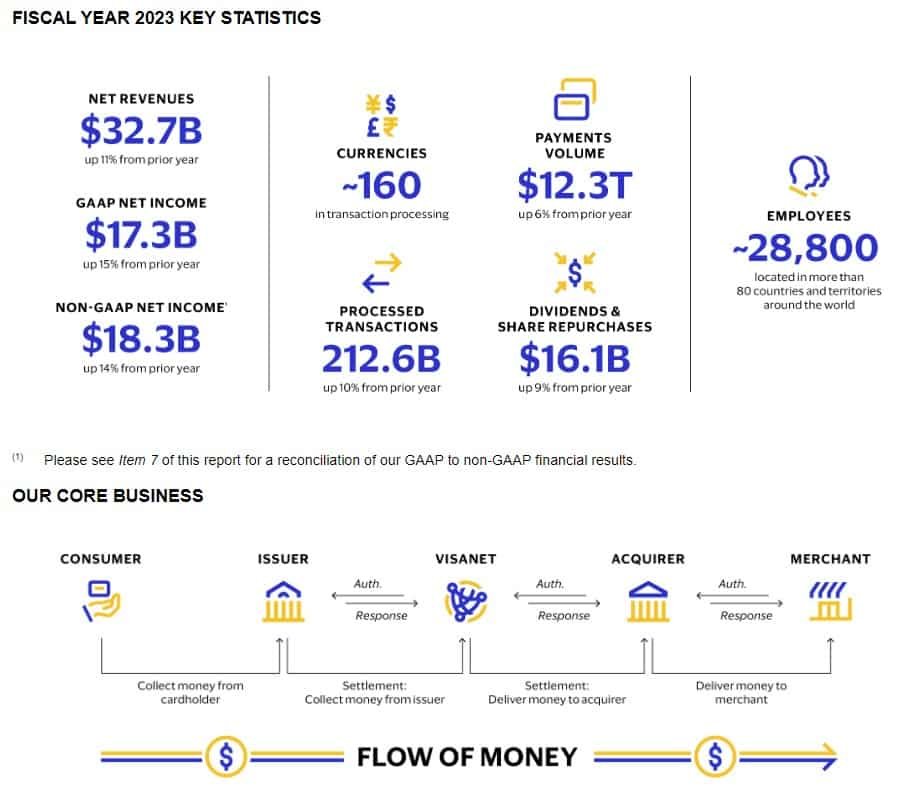
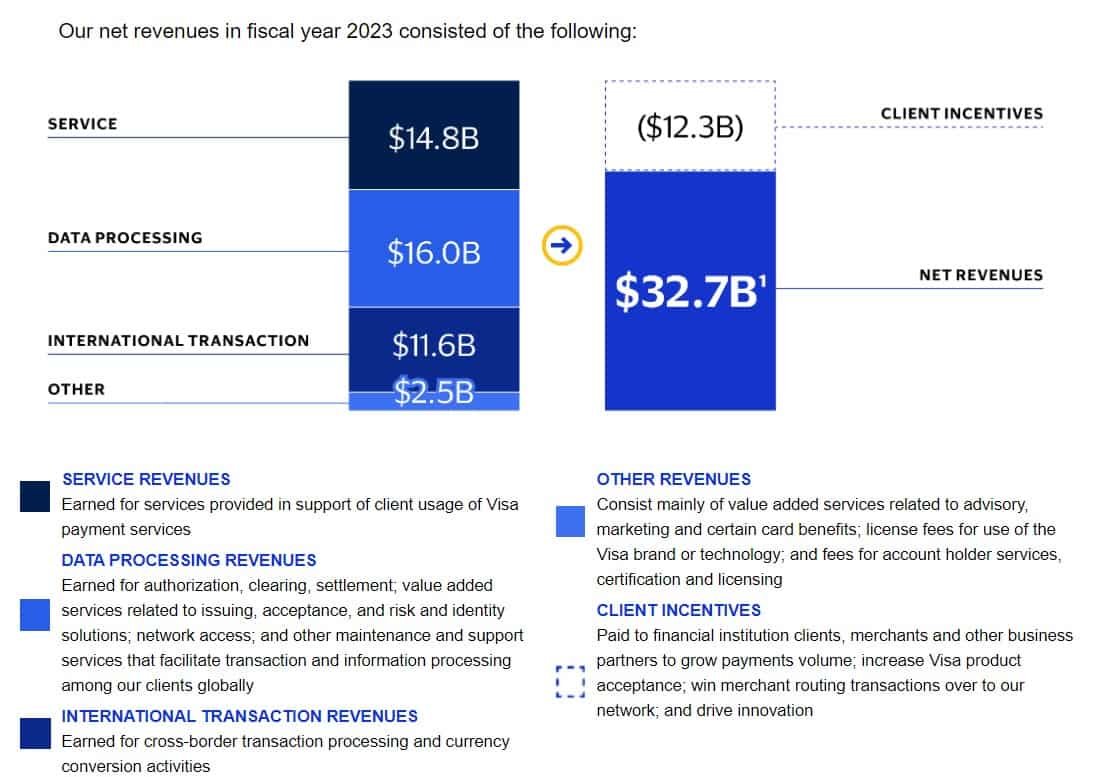
For example, Visa states that ” Visa is not a financial institution. We do not issue cards, extend credit or set rates & fees for account holders of Visa products nor do we earn revenues from, or bear credit risk with respect to, any of these activities.”[3]
This may surprise some people because without the knowledge of how Visa’s network works, they think that they are the ones that extend credit to consumers, which is not true. Visa primarily makes money by being the middleman between multiple financial institutions involved in a single credit card transaction. They charge fees for access to their proprietary processing network where they provide authorization, clearing & settlement services. They do not bear any direct credit risk of consumers not paying their credit card balances whatsoever. That falls on the bank that issues the card to the consumer.
Competitive Advantage is Key
Many investors fail to realize that a competitive advantage is what drives the performance & top tier metrics that you see when evaluate a great company & analyze stocks. A durable competitive advantage is vital for superior long-term profitability & shareholder returns. You may have heard a competitive advantage be referred to as a “moat”.
Sure, there are many companies whose stock price explodes each year based on the hopes that it becomes one of the darlings of Wallstreet like Amazon, Apple, Meta etc. And yes, you can make insane returns buying their stock. But it’s much more likely that you lose money on your investment when you’re just throwing darts. Instead, I prefer to focus on buying stock in only the best companies in the world. In order for a company to remain one of the best in the world & generate superior returns, they must have a competitive advantage in some part of their market(s). If they don’t, it’s just a matter of time until their business erodes & the value of your investment goes south.
This is why it’s vital to understand the various types of competitive advantages that exist. When you analyze stocks, you should ask yourself which advantage(s) does the company you’re looking at hold?
Companies that profitably offer comparable quality at lower costs will succeed. This can be due to better systems (higher productivity), negotiating better supplier pricing & much more.
Differentiation is the process of creating a product/service that is truly different or by creating the appearance of being different in the customer’s mind. This can be achieved by a unique brand image, “niching down”, superior marketing, higher quality, or any other specific attribute of the product, service, or company.
The phenomenon whereby higher usage/participation increases the value of the good/service for all users. When a company has established a meaningful network effect, merchants are almost obliged to use the network because this is where their customers are.
Access to resources that competitors cannot access is a massive advantage. This not only includes raw materials but also includes information, employee quality/talent, & access to debt markets & important suppliers.
Government policies, &/or innovation that leads to valuable patents/trademarks can unlock significant advantages that lead to unbelievable profits.
Visa benefits primarily from the network effect, cost advantages & regulatory advantages through their patents/trademarks. They benefit to a lesser extent from differentiation.
As you’re researching the qualitative aspects of a company, make sure you pin down which of these competitive advantages your company has, why they have it & whether it’s sustainable. This will go a long way in identifying the risks that pose threats to your company’s performance.
Be Aware of the Risks
First of all, there are zero investments that are “risk-free”. There are only levels of risk that exist on a spectrum going from low risk to high risk.
Even treasuries paying 5% carry the risk of returning less than inflation. There’s also a very small but non-zero chance that the U.S. Treasury defaults on its debt obligations.
When analyzing a stock, understanding all the risks that a company faces can be the difference between a good investment & a bad investment. To get a list of all the risks that a company faces, we go back to the annual report & familiarize ourselves with the “Risks” section. Here you will get a list of pretty much every conceivable risk that the company faces. In fact, it goes overboard. They will even point out a risk that is extremely unlikely to happen, & even if it does, it would have an immaterial impact on the company’s operations or profitability. But they have to list all these risks because if they don’t, you can bet that the company will be facing several lawsuits should one of the risks pop up & investors lose money because of it.
When analyzing a stock, it is up to you to gauge which of the risks are most likely & most detrimental to the company & your investment.
For example, after reading the risk section of Visa’s annual report, I have identified the following risks as the most impactful to the continuation of Visa’s dominance in the payment processing industry.
This is the most impactful risk to Visa’s competitive advantages. Visa would be able to adapt to higher debt servicing costs, higher expenses & a cap on the fees that they charge. Sure, it would slam their profitability & their share price would suffer, but they are a mere nuisance compared to a real threat to their ‘VisaNet’ Network.
The Federal Reserve is currently considering a proposal for a fee cap on debit card transactions.[4]
The two main expenses that Visa faces are Headcount & Client Incentives. Visa’s headcount has 3X over the past 9 years, which is not what you want to see. Likewise, Client Incentives eat up 27% of their revenue! That’s massive and something that they must keep a lid on.
If interest rates remain elevated, eventually Visa will have to rollover its existing debt at much higher rates than what they currently pay. This will increase the costs of obtaining a loan as well as the interest it pays on that debt. That could result in lower profitability & shareholder payouts via share buybacks & dividends. And what do you think happens to the share price of Visa if profitability & shareholder returns drop? Yeah, it goes down as well.
What's the Company Worth?
The last step in how to analyze a stock is our estimate of what a share in the company is worth & a plan for purchasing the shares if we decide this is an investment we want to make.
We already have the two estimates from Morningstar ($241/share) & CFRA ($230/share). It’s great when those two sources agree somewhat but there are times when they’re really far off. This is why I always run my own stock valuation.
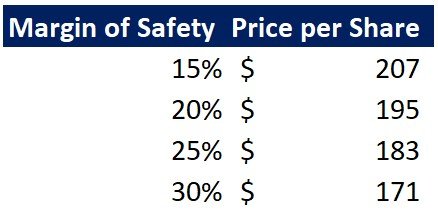
I use a discounted cash flow model that’s driven off of the stock based compensation (SBC) adjusted FCF/share. My DCF model gives an intrinsic value of $244/share which is slightly below where it’s currently trading. However, a prudent investor rarely pays full intrinsic value for a stock. It’s wise to build in a margin of safety.
When it comes to making the actual purchases, you need to determine how you’re going to deploy your capital. You could buy a lump sum right out of the gate. You could split it into 2-4 purchases at different intervals or you can dollar cost average (DCA). DCA is when you split your investment into smaller chunks, say 10, & slowly build up to your full investment over 6+ months.
Now, there is no right way to do it other than you probably shouldn’t go with a lump sum of more than $15k unless the company is extremely undervalued & you’re able to get it with a 20%+ margin of safety. I personally like to start with a $5-10k first purchase & DCA in $1-3k increments to build up to the full investment.
There’s a ton more to bet sizing that we won’t go into here. If that’s something that interests you then leave a message in the comments &, if there is enough demand for it, I’ll write an article around sizing your bets.
Now that you have a step-by-step process for how to analyze stocks, you’d don’t have to rely on the investment industry to tell you which companies to invest in.
Because who wants to invest in companies like Elevance Health, Chubb Limited, IQVA Holdings, XCEL Energy, or Fifth Third Bancorp? These are all mediocre companies at best. The only reason they’re in the S&P 500 is because they meet the flimsy requirements to be included.
You’re equipped with the power to invest in the best & forget the rest. Only the best companies in the world are good enough for your portfolio. So, get out there & practice what you’ve learned. It’s time to start building a portfolio of stocks that you’re proud to own.
[1] S&P U.S. Indices Methodology. S&P Dow Jones Indices a division of S&P Global. https://www.spglobal.com/spdji/en/documents/methodologies/methodology-sp-us-indices.pdf. Accessed 11/25/2023
[2] Cash vs. Accrual Accounting: Differences Explained. By Billie Anne Grigg & Hillary Crawford. https://www.nerdwallet.com/article/small-business/accrual-vs-cash-basis-accounting#what-is-cash-basis-accounting. Accessed 11/25/2023
[3] United States Securities And Exchange Commission: Visa Annual Report. https://www.sec.gov/ix?doc=/Archives/edgar/data/1403161/000140316123000099/v-20230930.htm. Accessed 11/25/2023
[4] Proposed Revision to Regulation II's Interchange Fee Cap. by the Board of Governors of the Federal Reserve system. https://www.federalreserve.gov/aboutthefed/boardmeetings/reg-ii-memo-20231025.pdf Accessed 11/25/2023
Get Our Latest Delivered To Your Inbox
You will receive 1-2 emails per month and you can unsubscribe at anytime


