Adaptable Wealth site logo
Search
Profit Loss Risk

Beginners Guide to Investing: Risk & Return

Home >> Invest >> Beginners Guide to Investing: Risk & Return

I don’t think the objective of investment should ever be to take a risk in order to get a return. I think the objective of shrewd investment should be to find opportunities which offer a larger return than the average, combined with adequate safety.

The purpose of investing in financial assets is to grow your financial wealth at an adequate rate without taking too much risk.

It’s a balancing act between your ability to withstand price volatility and losses, and realizing a high enough return to meet your financial goals. Take too much risk and it’s possible that you loose half or even all of your money. Take too little risk and it’s possible you don’t meet your financial goals.

In general, the higher the risk, the higher the potential return¹. But this is not always the case. There are plenty of investments with high risk but low returns or low-ish risk and above average or even high returns.

The key is to asses the risk/return trade off on a case by case basis and use probabilities to make the most informed decision you can.

I want to start off by making it very clear. The use of price volatility metrics as the primary gauge of risk is foolish! They capture historical price movements and provide a baseline at best. They cannot tell  you much about future risks or opportunities. You must define

those yourself by: 

  • Knowing the purpose of the investment in your portfolio
  • Discerning what the investment does and does not do well.
  • Understanding the micro economic picture such as the financial position of the company, company and industry trends, default risk, valuation risk etc.
  • Understanding the macro economic picture such as inflation expectations, interest rates, currency risk etc and how those will affect the value of your investment.
  • Read, read and read some more about the prospective investment. 

I will expand on this as we go but first, let’s review the investment industry’s risk assessment methodologies. The next time you get an investment proposal covered with these volatility metrics, you’ll know what you’re looking at, how to interpret them and what they’re good for.

Risk vs Return quadrants

Risk vs Return line


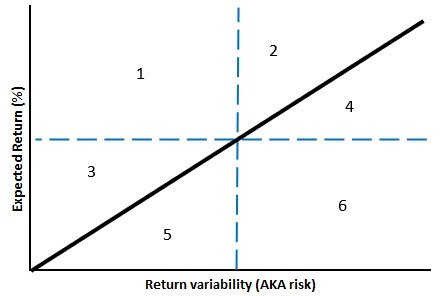
Ideally, you want to be on or above the line In the chart above. If you’re below the line, the variability of your returns is higher than your expected return.

Oddly enough, a majority of investments fall in sections 4 and 5 (below the line). Even stocks, the best performing asset over the past 100 years, fall in section 4.

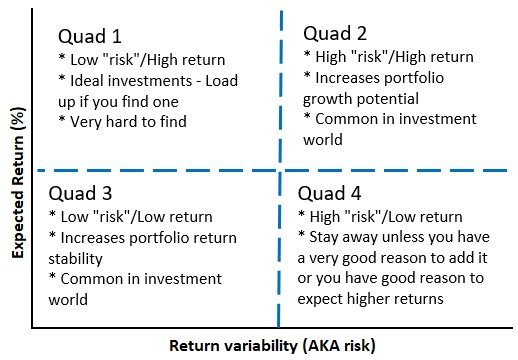
As I mentioned before, we want to find investments that generate as high a return as possible for a certain level of “risk” (variability of returns and loss potential). In order to find such investments, we need to look at risk adjusted returns.

A risk adjusted return is simply the historical return divided by a risk measurement over the same time frame. this fraction is interpreted as an estimated return per unit of risk. These metrics can be used to make high-level comparisons between different types of investments.


Summary

  • Return is the increase in the value of an investment plus any cash flow (dividends, interest etc.).
  • Risk is the possibility of a decrease in the value of an investment for any reason.
  • There are several methods of measuring return: absolute returns, trailing returns, avg. annual returns, annualized returns and Compound annual growth rate (CAGR).
  • There are several types of risk and methods of measuring risk: Standard deviation, Beta, Upside/Downside capture, % of periods with negative real returns.
  • Likewise, there are a few measures of the risk adjusted return: Sharpe Ratio, Sortino Ratio, Traynor Ratio and Alpha.
  • Managing risk requires that you understand your ability to deal with price variability and losses. Level of risk should be determined by your targeted return.
  • Successful risk management requires that you go beyond the usual risk metrics to understand the full picture of an investment.

Returns

Returns are simply the increase in value of our investment over a certain period of time (day, month, year, decade etc) plus any cash flow (Dividends, interest etc.).

Return should always be measured as a percentage to take the amount invested into account.

There are many ways to measure returns and each has its pros and cons. To avoid being hornswoggled or bamboozled, it’s important to understand the common variations of return you may come across on investment prospectus or fact sheet.

Absolute Return

Absolute Return is simply the % change between your initial investment and the ending value of your investment over a specified period of time.


Absolute Return formula


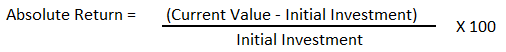
This is the basis for all other return calculations.


The main drawback of the absolute return is that it doesn’t take return variability, compounding or sequence of returns into account.
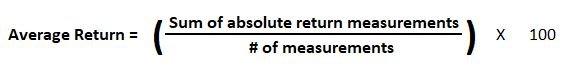
Average Return

Average Return is exactly what it says it is. Instead of taking the change in value over a long period of time, you take return measurements over a shorter period of time (daily, monthly or annually), and then you average them.


Let’s say you want to look at 3 year returns. You could calculate the return (using the absolute return formula) on a daily basis (756 measurements), monthly basis (36 measurements) or an annual basis (3 measurements). Then you take the simple average of your measurements.


Average Return Formula


The main drawback of average return is that it ignores the effects of compounding.

Trailing Return

Trailing Return is an average return calculation but instead of taking the average of smaller intervals, you calculate the absolute return over the longer time period and then divide by the number of periods.


Trailing Return formula


The most important difference between trailing and average returns is that trailing returns do not take variability of returns into account.


The main drawback of trailing returns is that it does not take compounding or sequence of returns into account.

Annualized Return

To annualize something is to multiply the number by a factor that converts it to a 12 month basis.


For example, if you took a measurement over a 3 month period, you would multiply that result by 4 (there are 4 groups of  3 to get to 12) and the result would be the annualized rate. So a 3% return over 2 months equals an 18% annualized rate (3% * 6 = 18%).


Annualized Return formula


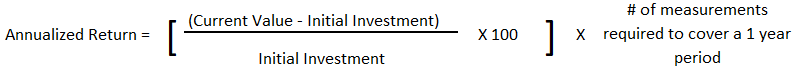
This method ignores compounding but does account for the variability of returns.

Compound Annual Growth Rate (CAGR)

This is the rate of constant compounded growth required to get you from your initial investment to your current value.


It is derived from the Future value formula FV = Current Value * (1+ r)^n.  All you do is algebraically manipulate the equation to solve for  r.


In my opinion, this is the best return measure to use for investment performance purposes because It directly accounts for the benefits of compounding.


Compound annual Growth Rate (CAGR) formula


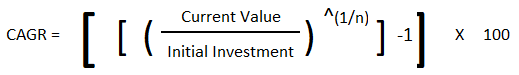
The main drawback of CAGR is that it does not account for variability or sequence of returns.


You can pair CAGR with a variability measure such as standard deviation, just make sure that both calculations use the same time frame.

Risk

In financial terms, risk is the possibility that the real return of an asset is lower than the return you need to meet your financial goals. There are dozens of types of risks. The most common are:

Inflation Risk

The risk that the return on your investments do not beat inflation and your purchasing power goes down.


Inflation is particularly detrimental to bond prices because the holder receives fixed (non-inflation adjusted) payouts over time. If prices go up, your fixed amount of interest now buys less than it would have before.


On the other hand, stocks have been shown to weather periods of inflation much better than bonds because their returns are not fixed and can beat inflation.

Credit/Default Risk

The risk that the company cannot repay their debt (you lose) or that their financial position deteriorates so much that their credit worthiness is downgraded.


A downgrade will usually reduce the value of the investment you hold.

Liquidity Risk

The risk that an investment you hold will either become very difficult to sell, which results in you having to sell at a large discount if you want to get out, or you may not be able to sell at all

Interest Rate Risk

The risk that changes in interest rates will reduce the value of your investment. This risk applies  primarily to debt financed investments such as bonds or house prices. However, we are seeing the stock market sell off due to rising interest rates at this very moment. This shows stocks can go down due to increasing interest rates as well.


Rising interest rates are especially detrimental to bond prices.


If interest rates go up, the price of all other bonds will go down (assuming all other factors remain constant). Likewise, if interest rates go down, then the prices of all other bonds will go up.


To understand why, lets go through an example.


Let’s say you bought a 1 year maturity bond with a 12% interest rate for $100.


If interest rates for that same issuers debt increase to 15%, assuming all other factors remain constant, would you rather have the bond paying 12% interest or 15% interest?


This is why the price of your bond will go down. Your bond just got less valuable because there are new bonds paying a higher interest rate and people would rather have the higher interest rate.


In fact, the price of your bond will go down by the exact amount needed to compensate a buyer of your bond to get that market rate of 15%.


If the other investor wasn’t going to get fully compensated, it would make no sense for them to buy your bond. They could just go buy the new ones and get the 15%.

Counterparty Risk

The risk that one or more of the counterparties to a contract do not hold their end of the bargain.


This seems similar to credit risk but it focuses on the willingness of the other party to abide by an agreement rather than the ability to repay.


I lump political risk into this bucket.

Market Risk

The risk that a decrease in the market to which your investment belongs reduces the value of your investment for no reason other than the fact that the market is going down.


This also covers systemic risk or the risk that the entire economy collapses like we saw in 2008-2009.


In those cases, every market falls.

Concentration Risk

A risk that arises due to having too much invested in one type of asset, one sector, one country etc.²


This is the opposite of diversification.

Valuation Risk

The risk that arises from investing in something that is pricey relative to the underlying fundamentals.


If you’re investing in a company with a 100 price to earnings ratio, it’s quite likely that you’ve paid too much for the stock and the expected returns on that investment are low.


There are many different valuation metrics. All should be used on a case by case basis. You can’t use a single value of a valuation measure to say whether an investment is over or under valued.

Correlation Risk

This is the risk that arises when you’re investments move in the same direction and similar magnitudes.


This exposes you to large drops in the market. If all your investments are highly correlated and the market drops, all of your investments will drop along with it.


Part of an effective diversification strategy includes assets that are either lowly or even negatively correlated to other investments in your portfolio. 

Call Risk

Call risk is mainly a bond risk as some bonds can be “called” if allowed in the contract.


This means that the issuer can force you sell their bond back to them.


The result is you lose the future interest payments that you expected to receive.


For bonds that are callable, this risk increases as interest rates decrease (your bond gets more valuable).


Reason being, If a company can now borrow at 2% instead of 6%, why wouldn’t they pay off their 6% debt and re-borrow at 2%?


If interest rates go up, then they have no incentive to call your bond because they’re already locked in at a lower rate.


If they do buy your bond back, you get lower interest for reinvesting your money. This is called reinvestment risk

Reinvestment Risk

This is the risk that either your bond is called or your bond matures at a time where the market is offering lower interest rates than you were receiving.


In both cases, you now have your cash but will get less interest than you were before.

Model Risk

Model risk is the risk that the inputs to a model used to project future risk and return estimates are grossly wrong.


Estimations, assumptions, and extrapolations are all factors that affect a prediction by a model. If any of them turn out to be terribly wrong, the prediction will be way off as well.

Business Risk

The risk that a company you invest in will not be able to generate enough profits to make your investment worth while.


This covers everything operation related ranging from a lack of demand for the firms products/services, to input cost increases and market competition.

Currency Risk

When you invest in foreign countries you introduce another variable. The change in value of your home currency relative to the value of the currency of the other country.


If you live in the U.S. and invest in a Canadian stock in Canadian dollars, even if the share value appreciates, you may lose money if the Canadian dollar depreciates in relation to the U.S. dollar.

Risk Measurements

When assessing the risk of an investment, knowing where to look is half the battle. Fortunately for us, this internet thing (I’ve heard it’s gonna be a big deal!) puts most of the information we need right at our fingertips. 

For example, it takes 5 seconds to search for “historical Inflation rate”. You’d quickly learn that the avg inflation rate over the past 107 years is 3.1% as measured by the CPI. That means your investments have to return at least 3.1% every single year just to break even in terms of the quantity of goods you can buy. Insane right? (It’s actually quite a bit higher than that! – See how the CPI is full of shit)

There are credit ratings available on tens of thousands of companies, for free, with a Moody’s.com account. These ratings assess default risk which necessarily gives you insight into the financial position of a company. 

You can get a gauge of liquidity by looking at the daily volume traded and the bid/ask spread of your targeted investment.

For valuation risk, you can use the standard metrics such as price to earnings, price to sales, price to book or price to cash flow for stocks.

For concentration and correlation risk, you’d have to pull in information about all your other investments to see if an investment you are considering helps in these regards. The best tool I’ve found for concentration is Morningstar’s X-Ray tool®. A limited version is available for free with a TD Ameritrade account.

The others are harder to get a good view on but you should try to at least get a feel for any type of risk that you can identify. You can do this by reading anything you can get your hands on regarding the investment.

The single best repository for information on any publicly traded company is the SEC’s EDGAR database. Here you will find all legally required documents ranging from earnings releases and insider buying and selling transactions, to annual shareholder meeting statements. There is a ton of information here. It’s very tedious to go through it all, but if you’re looking to get to know a company inside and out, this is where you can go.

 Lastly, I personally read reports from Morningstar, CFRA and the Vickers insider transactions reports; all available for free at Schwab.

Everything I mentioned above will help you gauge the current and future risks to an investment, but it does not help quantify that risk. In order to do that, we need to look at the statistical metrics developed by the financial industry to quantify the historical price volatility that an investment experienced. Just like all statistical analysis, we then assume that this variability will continue in the future with a certain level of confidence.

My approach is to use the following metrics to get a feel for the return variability of an investment, and then pair them with the information obtained from various other sources mentioned above, focused on current and future risks.

Standard Deviation

Standard deviation measures the variability of returns around the average over whatever period your return data covers. You should always know the average return and standard deviation of an investment.


Let’s say you are looking at an investment with the following 20 years of returns:


Standard Deviation example


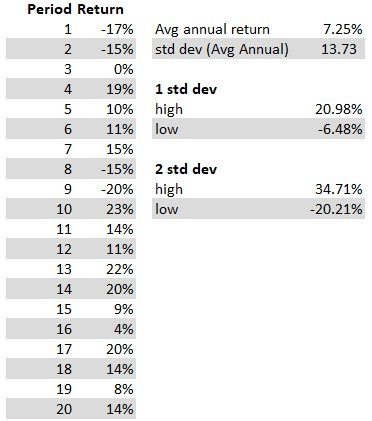
Over this 20 year period the investment has averaged a 7.25% return per year with a standard deviation of 13.73.


There is a basic statistical fact that states:


  • 66% of the time,  future expected returns will fall with in 1 standard deviation from the average

Take the average return and add (1 * std dev) to get a high threshold and subtract (1*std dev) to get the low threshold.


  • 95% of the time,  future expected returns will fall with in 2 standard deviations from the average

Take the average return and add (2 * std dev) to get a high threshold and subtract (2*std dev) to get the low threshold.


Applied to the data above, we can expect our return to be anywhere from -6.48% to 20.98%, 66% of the time. Likewise, we can expect our return to be anywhere from -20.21% to 34.71%, 95% of the time.


Besides the backwards looking nature of the standard deviation, another draw back is that it estimates the variability to the upside as well as the downside of the average return.

But as investors, we don’t consider a higher return than expected to be a risk. That’s what we want! That brings us to 3 other measures of return variability (“risk”).

Beta

Beta is a measurement of the change in your target investment relative to the change in some benchmark/Index. For stocks, that benchmark is something like the S&P500, the Nasdaq 100 or the Russell 2000. The benchmark for bonds can be treasuries or other bonds similar to your investment.


If your investment has a beta of .80 that means for each 1% change in the benchmark, your investment is expected to change by 0.8%. It works on the upside as well as the down side.


Beta < 1: Your investment will gain less and loose less than the benchmark most of the time.


Beta = 1: Your investment usually moves in lock step with the benchmark.


Beta > 1: Your investment will gain more and loose more than the benchmark most of the time.


Beta is primarily used as a gauge of market risk. But you must understand what benchmark you are comparing it to for it to be a valid piece of information.


I prefer to look at the return variability of the actual investment I’m interested in, but Beta can be useful when you don’t have access the actual returns of your investment. The logic is that if you are familiar and comfortable with the variability of the benchmark, and if the Beta of your target investment is close to 1, you can be pretty sure you’ll be comfortable with the variability of the investment; Depending on your objective of course.


To find something that is less variable, you’d look for an investment with a lower Beta.

Upside/Downside Capture

Like Beta, it is also a comparison of your investment to a benchmark.


The capture ratios show you historical performance of your investment on up days (upside capture) and down days (downside capture) with the benchmark being a value of 100.


Upside capture of 110 means that, on average, your investment will go up 110% of the change in the benchmark (benchmark + 10%) on up days.


Downside capture of 90 means that, on average, your investment will go down 90% of the benchmark (benchmark – 10%) on down days.


You want to minimize the downside capture and maximize the upside capture.

% of down periods or periods not beating inflation

This is one that I like to look at but it’s not found in any metrics commonly reported that I’ve found. You will have to calculate it your self.


It’s simply the % of time over a certain period that your investment has had a negative return or failed to return more than inflation.


Using the data in the standard deviation section above, you can see that out of the 20 years data we have, the investment has had 4 years with negative returns (20% of the time). About 1 in every 5 years, the investment loses money.


Extend this to look at the # of years that the investment didn’t beat inflation and you see that this has been 5 years out of 20 (25%).


You need to then determine if you are comfortable with those chances. You can also calculate the avg. return in those down years to get an extremely rough estimate of what type of loss you could expect should your investment not beat inflation.


For better estimates as to how big of a loss is possible at any given moment, check out Value-at-risk (Var) and Conditional Value-at-risk (CVar).

Risk/Return Measurements

Now that we have a general understanding of risk and return, we can look at the metrics commonly used to gauge the return per unit of “risk”, AKA risk adjusted return.

Sharpe Ratio

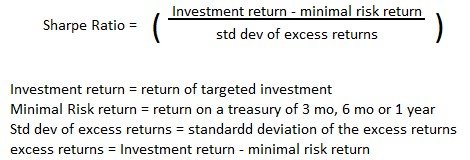
This metric measures the excess return per unit of “risk”.


The excess return is the return received above the least risky alternative (usually short term treasuries), while the “risk” is simply the variability of the excess returns.


In general, you want a Sharpe Ratio >= 1. A Sharpe < 1 means that an investment’s excess return is lower than the variability of those excess returns. In other words, the investment was not  able to generate enough excess return to compensate for the “risk” you took.


Sharpe Ratio


The use of the standard deviation as the denominator treats all excess return variability the same. In other words, returns higher than the low risk rate are just as unwanted as returns lower than the low risk rate.


Anyone with a brain understands that returns above the low risk rate are desirable while returns below the low risk rate are not. This is one of the drawbacks of the Sharpe Ratio.

Alpha

Alpha is similar to the Sharpe ratio in that it looks at excess returns. But instead of comparing an investment’s return to that of a low risk investment, it compares it to both a benchmark/index and the low risk investment.


Unlike the Sharpe Ratio, this metric only measures the variability due to the market.


As discussed earlier, Beta is the return variability of an investment relative to that of a benchmark/index.


Alpha is most commonly used in conjunction with Beta and is applied to a portfolio (your portfolio, mutual fund, ETF etc) rather than a single investment. 


In general, you want an Alpha >= 0. This means that the investment’s return was high enough to compensate for the risk associated with market conditions.


An Alpha < 0, means that it did not achieve a high enough return to compensate for the market/benchmark “risk”.


Alpha formula


A low risk investment is a 3 month, 6 month or 1 year treasury.

Sortino Ratio

The Sortino Ratio is also similar to the Sharpe Ratio in that it looks at the excess returns vs a low risk investment and is interpreted as a return per unit of “risk”.


Like the Sharpe Ratio, this metric considers risk from all sources not just the market.


But, unlike the Sharpe Ratio, which treats both positive and negative excess returns as equally undesirable, the Sortino Ratio focuses only on the negative excess returns; More in line with the true goals of investing.


Sortino Ratio Formula


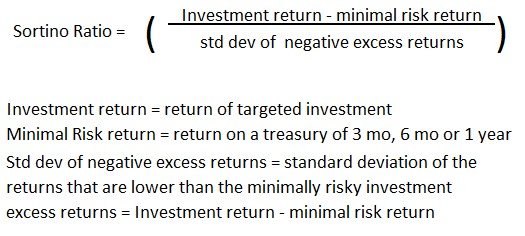
Just like the Sharpe ratio, you want a Sortino Ratio >= 1.
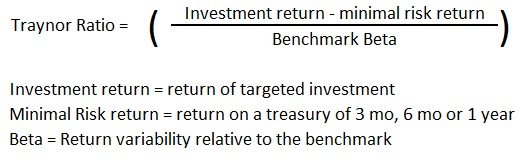
Treynor Ratio

Yet another variation on the Sharpe ratio, this one combines the ideas of the Sharpe ratio and Alpha. It takes the excess return and adjusts it per unit of market “risk” as measured by Beta.


As discussed before, Beta is a measure of variability relative to a benchmark/index and therefore only captures risks related to the market.


In general, you want a Treynor Ratio >= 1.


A Treynor Ratio < 1 means that the excess return is not enough to compensate you for the market “risk” as measured by Beta.


Traynor Ratio Formula

Managing Risk

When it comes to managing risk and setting an investment strategy, you should approach it in two ways.

  • Determine what level of return you need to meet your goals and fit a level of risk to that.

If you’re goal is to turn $10,000 into $100,000 in 10 years, you will have to take a radically different approach versus putting that $10,000 into a retirement account so it can grow for 40 years.

In the first scenario, you need to generate a 26% CAGR.

After arriving at a return target, you can then construct your portfolio to minimize risk for that level of return.

Again, the 26% return in the first scenario will necessarily require higher levels of risk than the second.

  • Determine a level of risk that you’re willing to accept and then fit a return to that. 

In order to get grounded on the appropriate level of risk for your investment strategy, you should answer the following 3 questions:

What is the $ for?

Money that is needed in the next 2-3 years should probably be held in more conservative investments such as high yield savings accounts or money market mutual funds/ETF’s.


Down payments on a car or house, savings for children’s college that will be used in the next year or two, savings for your upcoming wedding, a travel fund etc., are all instances where you’d want to be more conservative with that money.


Your ability to be conservative with the money is highly dependent on the inflation rate.


If inflation is not a problem and you can maintain your purchasing power by keeping the money in ultra-safe investments, then it’s usually the best to do so.


On the other hand, if the prices of the items that you intend to spend the money on are increasing faster than the interest rate you’re receiving in conservative investments, then you almost have to consider keeping at least a portion invested to try to maintain your purchasing power.


The percentage is up to you but in most circumstances it’s probably smartest to keep at least 40-50% in safe investments unless inflation is super high, like 10% or more.   


bonds - risk tolerance - what is the money for

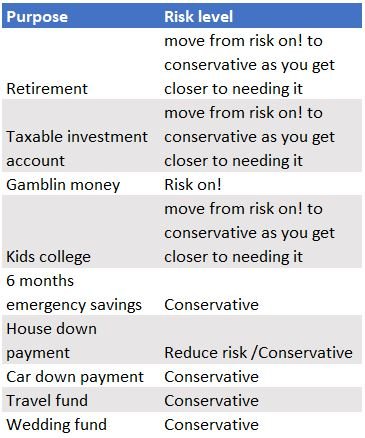
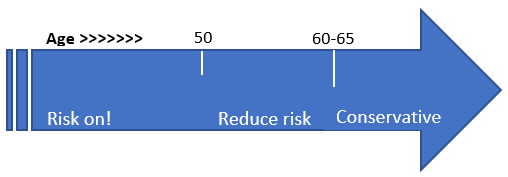
How long until you need the money?

If you are young and don’t need the money for a long time (retirement money), then mathematically speaking, you can afford to have a fairly large portion of your portfolio allocated to riskier investments offering higher returns.


If you receive poor returns for a few years (even 5 years), you’ll have plenty of time to recover.


The older you are, or the closer you get to needing the money, the generally accepted wisdom is to reduce risk. It’s wise to allocate a smaller portion to riskier assets and to increase your allocation to safer assets like cash, money market funds and/or bonds.


bonds - risk tolerance - how old are you

Can you stomach the risk?

Are you a person who can ignore market fluctuations and hold on for the long term?


If so, there is nothing wrong with taking on risk in pursuit of higher returns. As always, make sure you understand the risks and have a backup plan incase it backfires and ends up costing you money that you should have been protecting.


A useful exercise is to ask yourself, If I lost 40% of this money:


  • Would it severely affect my daily financial situation?
  • Would it cause undue stress and negatively affect my health or happiness?
  • Would it jeopardize the goal for which I’m investing?


If you answer yes, to any of these questions it’s probably too much risk for you.


Ask yourself the same questions if you lost 25% of the money, and again if you lost 15% of the money and so on.


Generally, you have to be willing to take a 30% loss to invest in the stock market. Most of the time you will make money, especially over long periods of 10 years or more, but big losses do come around once every 10-15 years.

Now that you have a basis for the risk that you are willing to take, it’s time to start searching for suitable investments.

For reference, the S&P 500 has a 50 year historical price variability of 16.84% and an average real return of 6.64%. This means that there is a 95% chance that in a any given year your returns are likely to range from a 27% loss up to a 40% gain. Add the fact that every once in a blue moon we get a 30%+ crash, and it becomes apparent that you better be willing to take a 30% loss if you decide to invest in the S&P 500. The magnitude of potential loss is even higher if you’re going to buy individual stocks or use options.

Then there are bonds, crypto, real estate, gold and silver, peer to peer loans, starting your own business or investing in someone else’s business etc. All of these have different return variability and other risks that need to be considered. 

To find suitable investments, you can use a stock or other screener to comb through all the potential investments with a standard deviation lower than 20, or a Beta < 1.10 or % of periods not beating inflation of 20%. What ever thresholds you choose.

Once you have a handful of investments meeting those “risk” criteria, you then dig up all the information you can. We want to see if any of them have generated a return acceptable for your goals and if they have other risks acceptable for your investment strategy.

Here at Adaptable Wealth, we never pigeonhole ourselves into one approach or way of thinking. In fact, I ALWAYS use both approaches! You should absolutely know what level of return you need to meet your goals. Not knowing this simple piece of information is like not knowing your destination when leaving for a trip. 

After I understand what level of return I need, then I can go back and attack the problem from the perspective of risk knowing that, if I want to meet my financial goals, I may have to take a little more risk than I’d like. 

Just like most things in life, balance is key, and knowing when the probabilities are in your favor for a big risky bet can be the difference between meeting your financial goals and coming up short.

Now that we understand the risk/return tradeoff, we are in a much better position to make an informed decision about what to invest in to meet our goals. You should understand what level and types of risk you’re comfortable taking and the return your targeting.

The next step is to look at the investments suitable for you and dissect them in terms of their risks, returns and their purpose in your portfolio.

Please note that investment decisions require careful consideration of many factors that are not covered here.

You need to factor in all information that applies to your situation before making any investments and if you are unsure what is right for you, I recommend consulting a certified investment advisor or financial planner, which I am not.

No matter what you decide, think several steps ahead and don’t get set on one way where you’re screwed if things don’t go as planned. Planning leads to options, options lead to adaptability.

¹Risk and return. Investor.Gov.    U.S. Securities and Exchange Commission. Accessed June 6, 2021. https://www.investor.gov/additional-resources/information/youth/teachers-classroom-resources/risk-and-return

²Concentrate on Concentration Risk. Financial Industry Regulatory Authority (FINRA). Accessed June, 12, 2021. https://www.finra.org/investors/learn-to-invest/advanced-investing/concentration-risk

Get Our Latest Delivered To Your Inbox

You will receive 1-2 emails per month and you can unsubscribe at anytime

Jump To

Most popular investing