Adaptable Wealth site logo
Search
prices for goods and services

Common Measures of Inflation

Home >> Protect >> Common Measures of Inflation

Although there are many ways to measure inflation, there are 3 primary measures of inflation used by economists, the government and investors. The first is The Consumer Price Index (CPI). The second is The GDP Personal Consumption Expenditure Price Index (PCE). The third is the Producer Price Index (PPI).

The CPI focuses on US urban consumer prices paid. The PCE focuses on domestic output regardless of who buys it. The PPI focuses on US producer prices received.


Summary

  • There are 3 common measures of inflation
    • Consumer Price Index (CPI)
      • Focuses on after-tax prices paid by urban consumers for over 250 goods & services.
      • Attempts to capture the average change in prices over time for the “average US consumer.”
      • Is used to adjust income eligibility levels for government assistance, federal tax brackets, & cost of living adjustments (COLA).
    • Producer Price Index (PPI)
      • Measures changes in the average pre-tax sale price received by US producers for their output.
      • Think of the PPI as a measure of prices received by one producer from another for their output as it moves up the supply chain towards the US consumer.
      • “PPI Personal Consumption – Final Demand” is the PPI most closely related to the CPI.
      • Tends to lead the CPI by a month or two. Unfortunately, it’s volatility makes it an unreliable indicator of future consumer inflation.
    • Personal Consumption Expenditures (PCE) Price Index
      • The US Federal Reserve follows The “core” version of this index as its primary measure of inflation.
      • Captures a much wider spectrum of consumer expenditures than the CPI does because it’s derived from GDP data.
      • Formula(s) adapt more easily to changes in consumer behaviors, product quality and product availability than the CPI.

To understand inflation jargon commonly quoted in the media, you must first understand the difference between Index levels and rates of change. We’ll then move on to dissect each of the 3 most common inflation measures.

Index

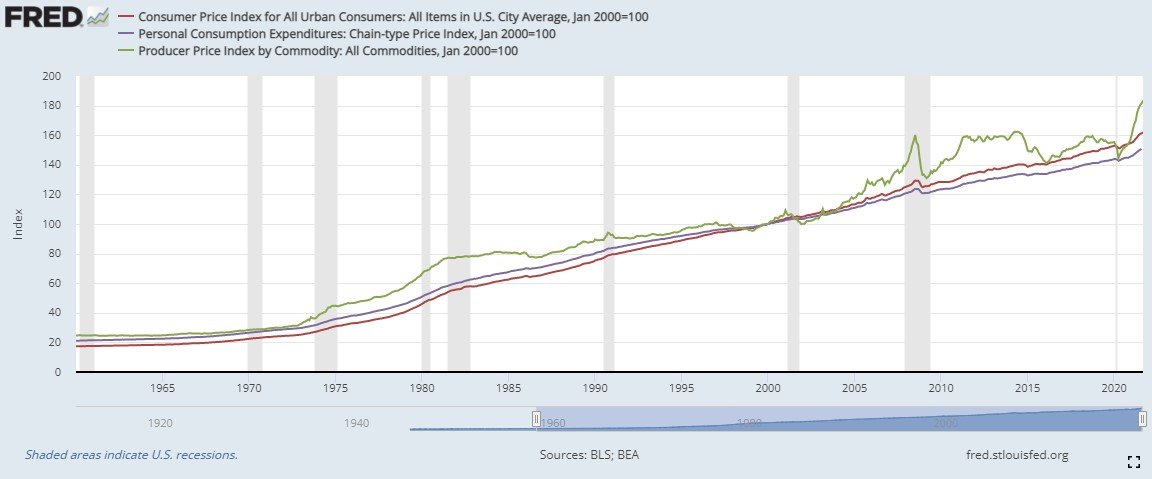
Indexes start at 100 in a “base year” and rise and fall over time. An index value of 125 represents a 25% increase from the base year (inflation), while a value of 90 represents a 10% decrease versus the base year (deflation). The CPI, PPI & PCE are all inflation indexes.


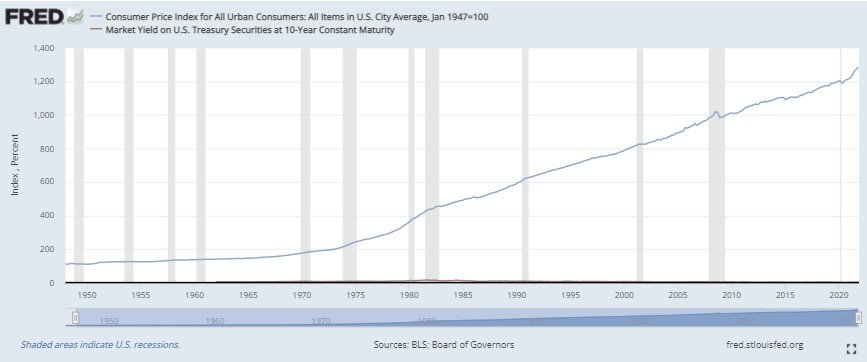
Indexes are helpful to gauge changes over long periods of time. For example, the Consumer Price Index (CPI) has a base year of 1983. In September 2021, the index value was 274. This means that since 1983, the “general price level”, as measured by the CPI, has increased by 174%!


Said another way, the purchasing power of your money has decreased by 66% over the past 39 years…. And the Federal Reserve sits there with a straight face and claims that it has met its mandate of stable prices. SMH


The CPI is one of the most common measures of inflation

Rates of change

Rates of change on the other hand, are comparisons of two periods from the index, usually to the prior month or year. Annual rates of change are what you will hear quoted in the media.


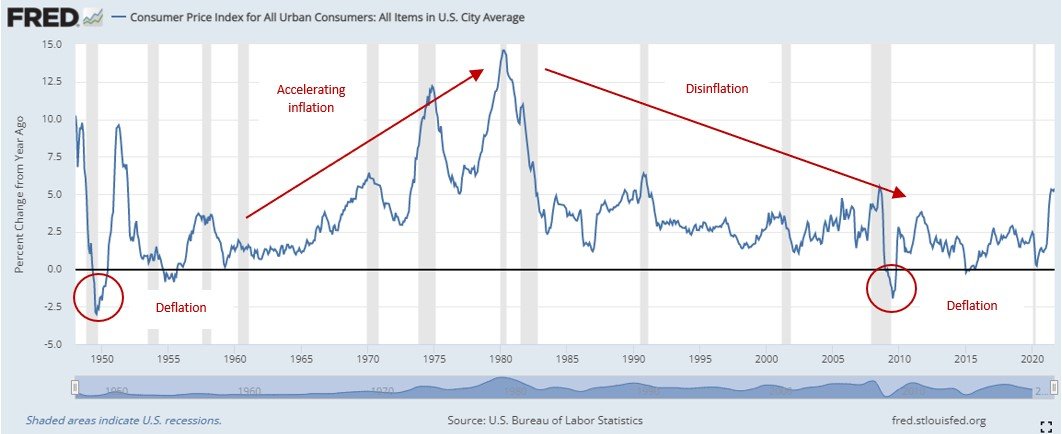
Positive rates of change show inflation, while negative values show deflation. We can take it a step further and look at the rate of change of the rate of change. If the rate of change is increasing, you are seeing accelerating inflation. Conversely, decreasing rates of change signify disinflation.


Don’t be confused by disinflation versus deflation. Deflation is the outright drop in prices. One the other hand, disinflation means that prices are still rising, just at a slower pace than before.


The CPI is one of the most common measures of inflation

Consumer Price Index (CPI)

The Consumer Price Index – Urban (CPI-U) is the most common measure of inflation. in fact, it’s the one you’ll hear quoted and discussed in the media. It accounts for nearly all residents of urban and metropolitan areas, which makes up approximately 93% of the US population.  

According to the Bureau of Labor Statistics (BLS), “The Consumer Price Index (CPI) is a measure of the average change over time in the prices paid by consumers for a representative basket of consumer goods and services. The CPI measures inflation as experienced by consumers in their day-to-day living expenses. The CPI is used to adjust income eligibility levels for government assistance, federal tax brackets, federally mandated cost of living increases, private sector wage and salary increases, and consumer and commercial rent escalations.”1

First, the BLS starts with a bunch of goods and services bought by most consumers. The next step is to estimate monthly changes in their aggregate price level. Finally, they weight each component to produce an aggregate index.

The weightings, as of October 2021 are as follows:

CPI weightings 2020

Advantages
  • Captures over 90% of the US population in the CPI-U metric.
  • Although the headline figure gets the most attention, the data is broken down into geographic direction (N/S/E/W), major city, and population size classes of urban areas.
  • Covers over 200 types of goods and services.
  • Measures after-tax consumer prices paid so it more closely aligns with the true cost of a good or service.
  • Indexed – This allows for an easy comparison of prices from one period to the next, and over long periods of time, with a simple % change calculation.
  • Attempts to adjust for quality changes & product availability – This is seen as manipulation by some and could easily be included in the disadvantages section.
  • Factors in rents which are not captured by the PPI or PCE.
Disadvantages
  • Rigid in its Scope and weightings.
    • Changes to scope and weightings have to be made manually.
    • Misses the substitution of one good for a another due to rising prices (ex: chicken for beef).
    • Can cause the index to miss some expenses that are becoming a more important part of consumer expenditures until it’s decided they should be included.
  • Based on consumer surveys which are perceived as inferior to business surveys.
    • Households may understate expenditures on “sin items” such as tobacco and alcohol, which can change the weightings of certain items within the index.3
  • Will not give you an accurate measurement of your own inflation rate unless your expense weightings are close to that of the CPI (see weightings chart above).
  • Uses “Owners equivalent rate” rather than house prices to gauge changes in the cost of owner occupied “shelter.”
  • The regional, city level and population size indices cannot be compared with each other.
    • These indices are meant to be used for tracking changes in prices over time for a given region, city or population size only.
  • Not forward looking. Measures what has already happened with a one-month lag.

Producer Price Index (PPI)

The Producer Price Index (PPI) is the 2nd most common measure of inflation. It measures changes in the average sale price received by US producers for their output. It covers several industries including mining, manufacturing, agriculture, fishing, forestry, natural gas, electricity, construction, waste, and scrap materials. 

While the PPI is kinda like “the CPI but for producers,” the two have completely different purposes. The CPI focuses on after-tax prices paid by US consumers, while the PPI focuses on the pre-tax prices received by US producers.

Think of the PPI as a measure of prices received by one producer from another as it moves up the supply chain towards the US consumer. It’s the prices received in these types of producer-to-producer transactions that are the focus of the Producer Price Index (PPI).

To get a view of the goods and services moving up the supply chain, the BLS breaks the index into two stages of what they refer to as “stages of demand”.

Intermediate Demand

Intermediate demand refers to goods and services used as inputs into other goods and services.

For example, let’s say company A sells plastic pellets while company B produces coffee makers. The sale of plastic pellets to company B would be considered intermediate demand because the plastic pellets will be transformed into coffee makers. The electrical components of the coffee maker would also be counted as intermediate demand.

Final Demand

Final demand is a little different. Rather than focusing on goods and services that are then used in the production of other goods and services, final goods are sold for personal consumption, capital investment, export, and to the government.4

The PPI focuses on prices received, not paid, for a reason. It’s because there is one last part of the value chain that must be accounted for to get a view of the entire domestic production process; The consumer of the final product. 

If we were to look at it from the point of view of prices paid by producers, we wouldn’t be able to include this last sale because consumers are not producers. Therefore, we must look at it as prices received so we can capture this “final demand” sale and get a picture of the whole value chain.

Personal Consumption - Final Demand

A subset of the “Producers Price Index – Final Demand” is another index called the “Producer Price Index for Personal Consumption”. These are the goods and services that are sold to the US consumer.

Although there are a few other methodological differences between “Personal Consumption – Final Demand” and the Consumer Price Index (CPI), this is the segment that most closely aligns with the CPI.5

Overall, the PPI is a valuable metric and some economists and investors use it as a leading measure of consumer inflation. However, it’s very volatile and spikes in the PPI commonly do not lead to meaningful spikes in consumer prices.

Spikes in the PPI rarely lead to spikes in the CPI

Advantages
  • The Personal Consumption segment of final demand can give valuable insight into where the CPI may be headed.
  • There are approximately 10,000 PPI’s for individual products and groups of products so you can find the changing production costs for pretty much any good and many services.
  • Provides insight into causes of consumer inflation as it tracks production costs throughout the supply and value chains.
  • Covers entire market output of US producers.
  • Based on business surveys which tend to have better response rates and response quality than consumer surveys.6
  • Indexed – This allows for an easy comparison of prices from one period to the next, and over long periods of time, with a simple % change calculation.
Disadvantages
  • Very volatile – Even though you may get a few month trend in the PPI, it can quickly turn to the opposite direction making forecasting and drawing conclusions quite difficult.
  • Only captures approximately 72% of service sector output.7
  • Does not include rent costs as they are not considered inputs to production.
  • Not forward looking. Measures what has already happened with a one-month lag.

GDP Price Indexes

There are 4 other measures of inflation derived by the US Bureau of Economic Analysis (BEA). The first is the Personal Consumption expenditures Index (PCE). The second is the Gross Domestic Purchases Index. The third is the GDP Price Index. The fourth is the GDP Price Deflator.

Because the BEA is responsible for measuring and reporting GDP, their inflation metrics are all related to their GDP calculations.

There are 5 different GDP price indices

Personal Consumption Expenditures (PCE) Price Index

The PCE is derived from the GDP measurements. As a result, it captures a much wider spectrum of consumer expenditures than the Consumer Price Index does. The formula used is also more easily adaptable to changes in consumer preferences. For example, if the price of pork goes up, consumers may decide to buy less pork and instead buy more chicken. This is known as the substitution effect. Neither the CPI nor the PPI are as nimble to adjust to such dynamics.

Lastly, the BEA revises historical PCE data to reflect updated information or a methodology changes when necessary.

These are only a few reasons why the US Federal Reserve officially follows the PCE (core PCE to be exact) as its primary inflation measure.8       

Although the PCE has these three theoretical advantages over the CPI, they are practically mirrors of each other with the CPI usually running a bit higher than the PCE.9 The PCE is also slightly less volatile from month to month.

PCE is slightly lower than the CPI

Gee, I wonder why the Fed would want to change their preferred inflation gauge to the PCE. Couldn’t have anything to do with the fact that it has consistently been lower than the CPI for the last 20 years could it…….

Advantages
  • Covers a much wider range of goods and services than the CPI (because it’s based on all US GDP) – Has its drawbacks though.
  • Uses a formula that more easily allows for changes in consumer preferences and product availability.
  • Historical data is revised with updated information or methodology changes when necessary
  • More stable (less volatile) than the CPI & PPI.
  • Indexed – This allows for an easy comparison of prices from one period to the next, and over long periods of time, with a simple % change calculation.
  • Is a chain-weighted index so comparisons over time are more accurate.
Disadvantages
  • Incomplete data – Is a monthly measurement but uses GDP as a calculation component.
    • GDP is only measured quarterly. This requires “adjustments” for the two months between GDP releases.
  • Not forward looking. Measures what has already happened with a one-month lag.
  • Omits financial assets such as stocks, bonds, insurance etc. because they are not included in GDP.
  • Potentially understates rent and house price impacts on inflation because of its much smaller “housing” weighting (approx. 25%) than the CPI (approx. 42%)
    • This is a result of its wider range of goods and services due to the fact that it’s based on GDP rather than just consumer expenditures like the CPI is.

In summary, the Consumer Price Index (CPI), the Producer Price Index (PPI) and the Personal Consumption Expenditures Index (PCE) are the 3 primary measures of inflation. While each has it’s advantages and disadvantages, the US Federal Reserve decided to focus on the PCE as it’s main measure of inflation for the US consumer. 

Personally, I think they do an okay job at measuring changes in prices based on their stated objectives. However, the BLS and BEA employ some questionable tactics and methodologies that lead you to at least question the accuracy of the CPI and PCE. We’ll discuss the problems with these measures of inflation in part three of the series.

1Consumer Price Index: Calculation. BLS   https://www.bls.gov/opub/hom/cpi/calculation.htm. Accessed 10/23/2021

2 US Bureau of Labor Statistics. Relative importance of components in the Consumer Price Indexes: U.S. city average, December 2020. https://www.bls.gov/cpi/tables/relative-importance/2020.htm Accessed 10/24/21

3 A Comparison of the CPI and the PCE Price Index. Federal Reserve Bank of Kansas City. https://fac.comtech.depaul.edu/topiela/content/021_CPI%20and%20PCE%20Comparison%201999%20INFL%20ASAD.pdf. Accessed 10/26/2021

4 US Bureau of Labor Statistics. Producer Price Indexes – September 2021. https://www.bls.gov/news.release/pdf/ppi.pdf

5 US Bureau of Labor Statistics. Comparing the Producer Price Index for Personal Consumption with the U.S. All Items CPI for All Urban Consumers. https://www.bls.gov/ppi/methodology-reports/comparing-the-producer-price-index-for-personal-consumption-with-the-us-all-items-cpi-for-all-urban-consumers.htm Accessed 10/24/21

6 US Bureau of Economic Analysis & US Bureau of Labor Statistics. A Reconciliation between the Consumer Price Index and the Personal Consumption Expenditures Price Index. https://www.bea.gov/system/files/papers/P2007-4.pdf. Accessed 10/25/2021

7 US Bureau of Labor Statistics. FAQ’s – How does the Producer Price Index differ from the Consumer Price Index. https://www.bls.gov/ppi/faqs/questions-and-answers.htm#4 Accessed 10/24/2021

8 Board of Governors of the Federal Reserve System. Federal Reserve issues FOMC statement of longer-run goals and policy strategy. January 25, 2012. https://www.federalreserve.gov/newsevents/pressreleases/monetary20120125c.htm. Accessed 10/24/2021

9 Federal Reserve Bank of Cleveland. PCE and CPI Inflation: What’s the Difference? https://www.clevelandfed.org/en/newsroom-and-events/publications/economic-trends/2014-economic-trends/et-20140417-pce-and-cpi-inflation-whats-the-difference.aspx Accessed 10/24/2021

Get Our Latest Delivered To Your Inbox

You will receive 1-2 emails per month and you can unsubscribe at anytime

Jump To

Most popular Protect

Leave a Comment

Your email address will not be published. Required fields are marked *

This site uses Akismet to reduce spam. Learn how your comment data is processed.