

I’d like to start off by recognizing that the BLS & BEA have an impossible job. Trying to produce an unbiased and accurate measure of changing prices in a highly emotionalized, whimsical economy, is impossible. Literally impossible. It doesn’t matter which collection techniques or statistical methodologies they use. It doesn’t matter what “adjustments” are made. There will always be some things understated and some things overstated. Someone will be unhappy with the measurement. Economists and the government complain that there are problems with the CPI that overstate inflation. One the other hand, consumers complain that there are problems with the CPI that understates inflation.
Overall, I find all three of the metrics discussed in part two to be “in the ballpark” for their stated objective.
Problems arise when they make certain adjustments or omissions. As I’ll point out, such adjustments usually lead to lower inflation readings. In their narrative, the problem with the CPI is that it overstates inflation. Adjustments are needed to reduce the readings so that they “accurately reflect the true cost of living.”
Summary
- The BLS & BEA have an impossible job – They will never satisfy everyone’s opinion of what an inflation metric should & shouldn’t measure or account for.
- 5 problems with the CPI & PCE that lead to an understatement of inflation:
- They Exclude Financial Assets
- Even though they’re not a consumption good, financial expenditures are absolutely a major consumer expense.
- They Exclude House Prices
- “Owners Equivalent Rent” (OER) is used instead of market-based sales prices.
- Using the Case-Shiller Home Price Index (HPI) would increase the the owner owned housing portion of the CPI by 134%.
- The OER takes what is supposed to be a measure of owner occupied housing costs and turns it into a measurement of investment revenue – The exact opposite of what the stated objective of the CPI is.
- Core Inflation Rates
- Energy is very volatile. Removal from the aggregate measurement is reasonable. Removal of food is not reasonable.
- Removing 14% of the population is bound to introduce bias into the measurement.
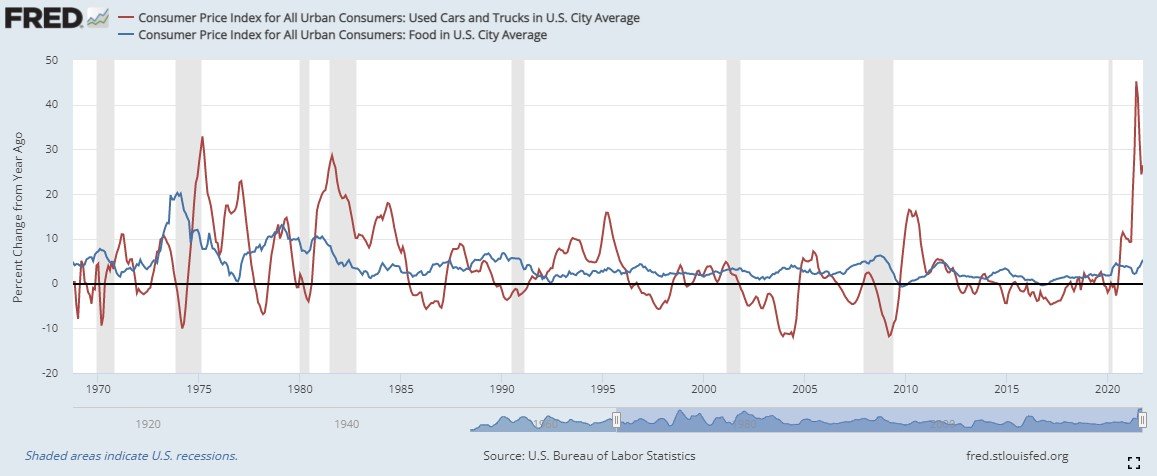
- There are several other components that are much more volatile than food (ex: Used cars & trucks).
- Energy is very volatile. Removal from the aggregate measurement is reasonable. Removal of food is not reasonable.
- Hedonic Quality Adjustments (HQAs)
- HQAs ignore the the fact that consumers have to pay higher prices for the additional functionality that technology brings, even if they don’t want or need it.
- Adjustments can be quite large. Ex: 45% increase in new car prices is reported as a 4.9% increase in the CPI.
- Substitution vs Fixed Basket Weightings
- Fixed weightings allow us to track what the same goods and services would cost over time.
- The CPI counts the substitution to a lower quality good or service as a price reduction without consideration for the reduction in quality.
- They Exclude Financial Assets
- Inflation rates are personal
- The CPI & PCE measure inflation for the “average consumer.” – They “seldom mirror a particular consumer’s experience.”
- You personal inflation rate depends on 3 variables.
- Weightings – Your personal mix of good and services that you spend your money on.
- Rate of price changes in those items.
- Location – Where you live and/or purchase goods and services.
In all fairness, here is an in-depth article arguing that the problems with the CPI & PCE lie in the overstatement of inflation. They conclude that better methodologies are needed to reduce the overstatement.
Now that you have the opposing point of view, here are 5 reasons that the problems with the CPI & PCE lie in the understatement of inflation. As we go, I’ll point out questionable adjustments and methodology changes, even possible manipulation.
1. They exclude financial assets (stocks, bonds etc.)
As mentioned in part two of this series, Common Measures of Inflation, the PCE is derived from GDP calculations. Therefore, it ignores financial transactions because they do not directly contribute to output (GDP). Whether the CPI should include financial assets is a bit trickier.
According to the BLS, the CPI measures the “average change over time in prices paid by urban consumers for a market basket of consumer goods and services.” Financial assets are excluded because they are “related to savings, and not day-to-day consumption expenses.”
I disagree with the exclusion of financial assets for 3 reasons.
First, the claim that they are not daily expenses is nonsense. “Retail investors” buy and sell stocks and bonds every day. The “average consumer” buys savings products every day.
Second, although financial products are not a consumption good, they absolutely are a major consumer expense in this age of financialization. When you make a budget, do you not have a line item for savings and investments? I know I do.
Apparently, I’m not alone. American’s save approximately 5-6% of their disposable income since 2000. According to the BEA, the personal savings rate can “generally be viewed as the portion of personal income that is used either to provide funds to capital markets or to invest in real assets such as residences.”
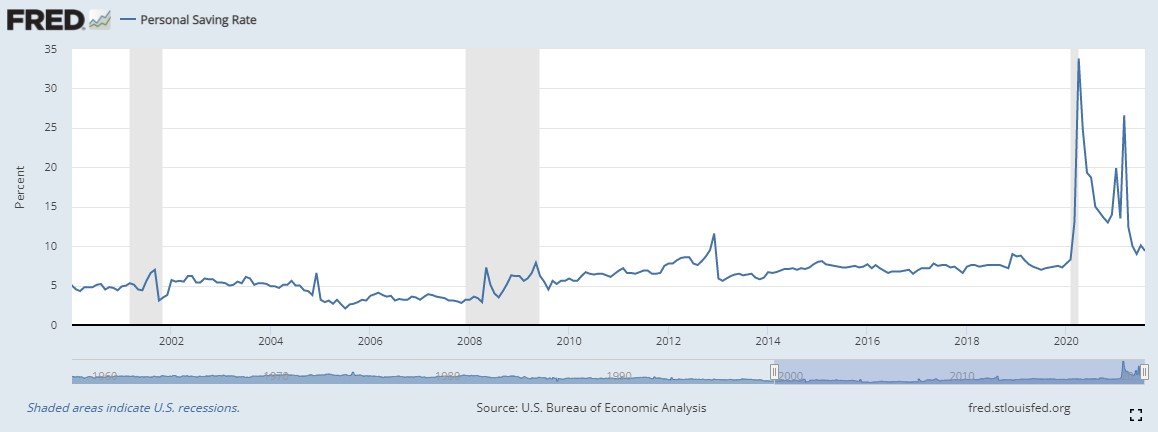
That’s right. Capital markets and other assets. So, 5-6% of income flows into stocks, bonds, and savings products, but they’re not included in our inflation metrics. Odd….
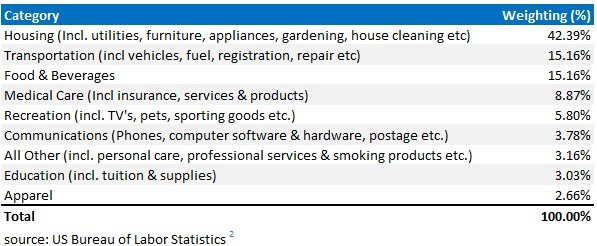
Compared to the CPI weightings, financial assets are a larger consumer expenditure than clothes, education, and communication.
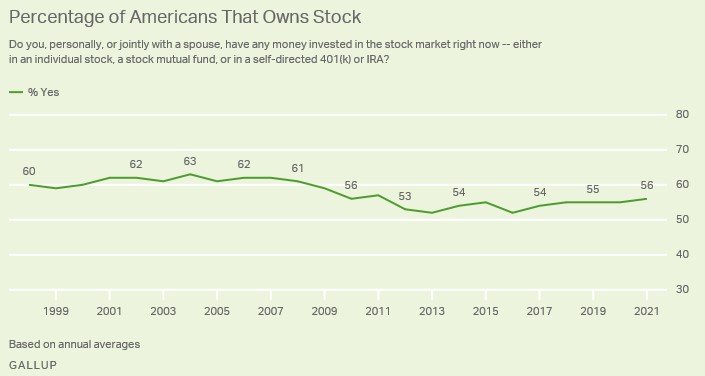
Finally, a recent Gallup poll showed that 56% of Americans own stock in some fashion in 2021.1 That is the “average consumer” by definition. 50% do and 50% don’t. Furthermore, that’s just stocks. If we included bonds, savings accounts, and other financial assets, the percentage would be much higher.
The main counter argument to these facts is that we want financial asset inflation because we benefit from it.
To an extent I agree, but do we really benefit from all causes of asset inflation? What happens when asset inflation gets out of control due to excessive debt and money printing by the Federal Reserve? It creates economic instability and eventually asset prices crash. All that fictitious wealth that we supposedly benefit from evaporates. The usual outcome is that people lose their jobs. So, do we really benefit from all sources of asset price inflation? No.
In my opinion, some sort of consideration should be paid to financial asset inflation.
2. They exclude house prices
Originally, the CPI measure of homeowner cost was based largely on housing prices.3 In 1983 they argued that a house can be considered both a consumption good and an investment, depending on the buyer’s intent. For this reason, they decided to replace house prices with the concept of “Owners’ Equivalent Rent” (OER). This is defined as the “implicit rent that an owner would have to pay if they were renting their own homes.”
The logic is twofold. One, the CPI is a consumer-focused index. Therefore, investment related housing activities should be excluded. Makes sense so far but then it gets a bit shady.
Two, the BLS argues that when someone buys a house, they’re really purchasing shelter. Ok, I agree…. but instead of using the price actually paid for the house, they’ll use the current “rental price” of the house.
Let me get this straight. Someone bought a house as a consumption good, but the BLS wants to measure it as an investment?……
The exact opposite of what their stated goal is….
It gets better…..
To come up with the current “rental price,” they decided to use a questionnaire to ask the property owners the following question:
“If someone were to rent your home today, how much do you think it would rent for monthly, unfurnished and without utilities?”3
What we end up with is potentially biased rental estimates accounting for the largest single component of the CPI. Comically, the BLS could effortlessly use actual sales prices of owner-occupied houses. They know who owns the owner-occupied properties. They identify them for the Consumer Expenditure Survey used to calculate the OER!
The impact of using rents instead of house prices is to reduce the CPI. House prices, as measured by the Case-Shiller Home Price Index (HPI), have consistently increased more often than rents.
This is absurd to put it nicely!
They could easily use actual prices paid or market-based rents.
Instead, they leave it up to a homeowner who may or may not have any clue how to determine a reasonable rent.
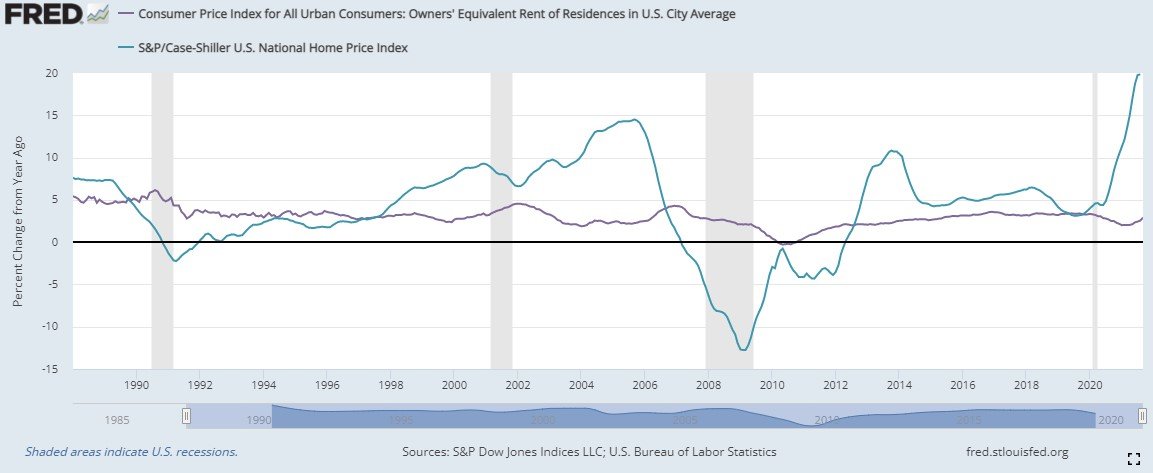
In fact, monthly home prices grew 4.3% per year (CAGR) over the 1987-2021 period, versus 3.1% for the OER. This has led to the HPI being 139% higher than the OER over the same period!
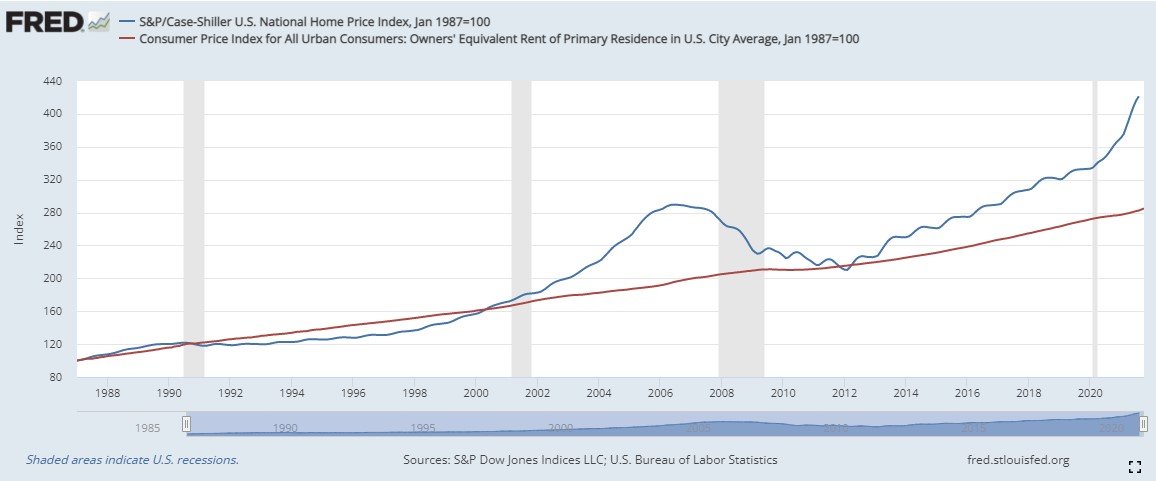
One of the most glaring problems with the CPI is now obvious. Including house prices would have pushed the CPI up quite a bit versus official measurements over the past 34 years.
But should house prices be a part of a consumption focused index? Well, owner-occupied housing is as much a consumption good as renting a house. The CPI includes rents. Why would it exclude an owner-occupied property?
3. They prefer to look at "core" inflation rates
Energy is very volatile. I completely understand why they’d prefer the measurement without it.
Removing food, however, makes little sense to me.
First, food accounts for 14% of the CPI. You can’t just remove 14% of your population without introducing some bias into your measurement.
Second, the food component of the CPI is no more volatile than the unadjusted metric.
Lastly, other components in the Consumer Price Index contribute the same amount to the volatility of the index. Take used cars and trucks for example. It’s monthly standard deviation since 2000 is 7.39% vs 1.39% for food. Adjusting for their relative weights, they end up contributing about the same amount of volatility to the aggregate index.
This is one of the less egregious problems with the CPI since all cost-of-living adjustments (COLA) are based on the unadjusted CPI.
4. Hedonic Quality Adjustments
The use of “Hedonic Quality Adjustments” (HQA) is yet another point of contention between those who favor the approaches of the BLS, and those whose cost of living is rising much quicker than the CPI shows.
Product characteristics, capabilities, and quality change over time. Additionally, companies discontinue products and replace them with other products, usually with a higher price. The BLS had to find a way to estimate the price of the new product had it existed before.
To do this they break the new product into its various components. Next, they find products with and without those same features to estimate the price increase due to each feature. Finally, they add those incremental price estimates back to the product without the new features. This raises the price of the product without the new features. As a result, the % change between it and the newer, better product is smaller.
You don’t have to take my word for it. You read the following example on the BLS website.
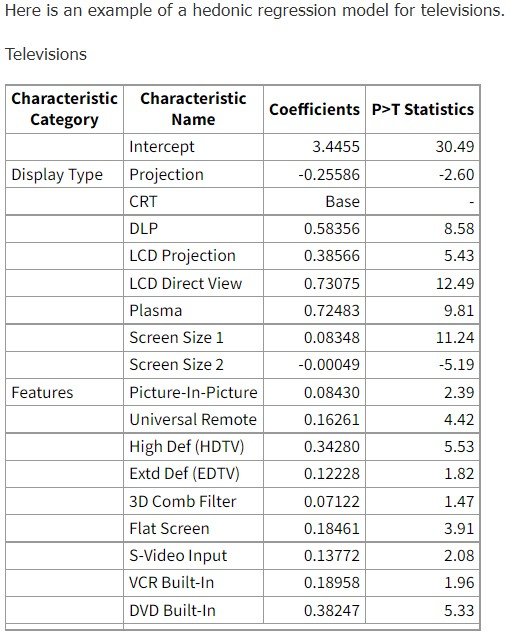
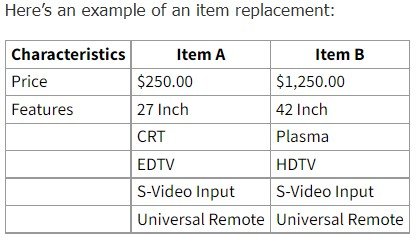
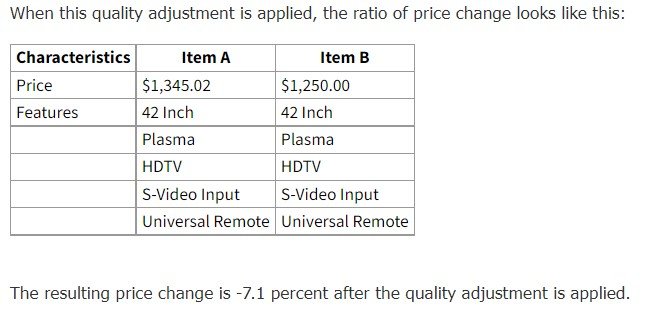
I couldn’t believe my eyes when I read this. They took a 400% price increase and manipulated it down to a 7% decrease. This is just an example though. The impact due to HQAs is much smaller.
However, the BLS released a report titled Hedonic Quality Adjustments in the US CPI: A Statistical Agency Perspective4. It goes through each of the areas where HQAs are used and estimates the impact to the CPI. Based off their own estimates, there is no doubt that the general bias of HQAs is downward. Additionally, this report was published back in 2002. Imagine the impact 20 years later as technology has grown significantly as a share of the CPI.
The primary problem with HQAs is that they do not consider that consumers out of pocket expenses are going up. They’re forced to pay a higher price for a higher quality good or service that they may not want. Take the price of new cars for example.
Here we have the average transactional price of new cars from Edmonds.com. This is a gauge of the actual average price that consumers paid for a new car. They show a 45% increase from 2002 to 2019.5
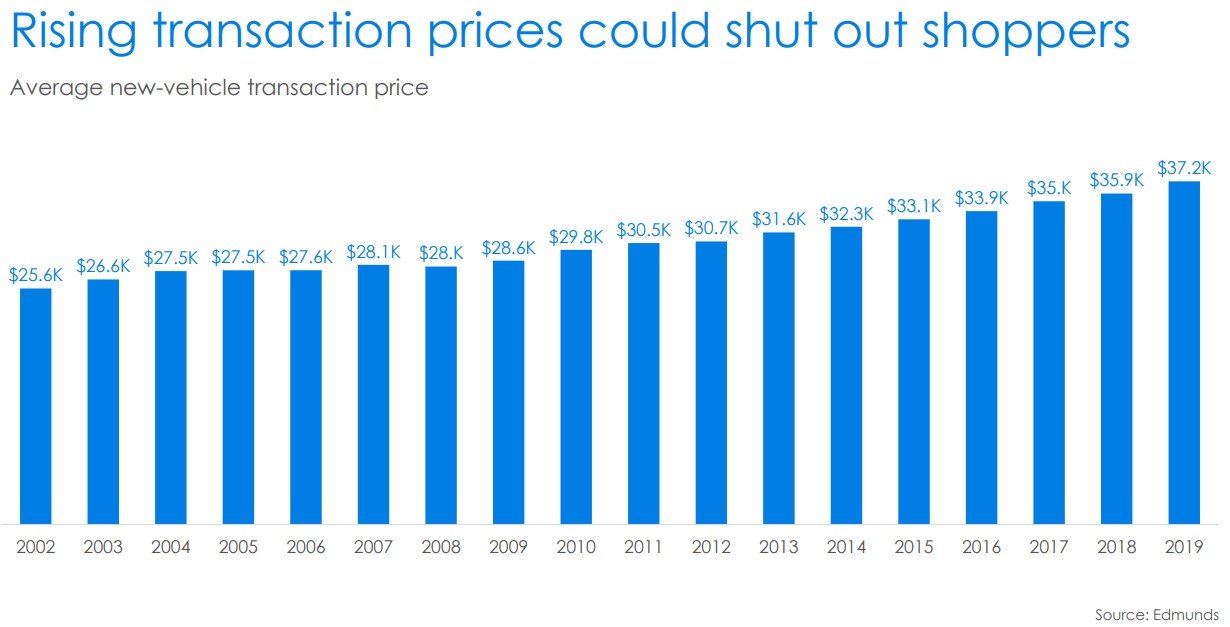
Here we have the CPI New vehicles price index over the same period. It shows a 4.9% increase!
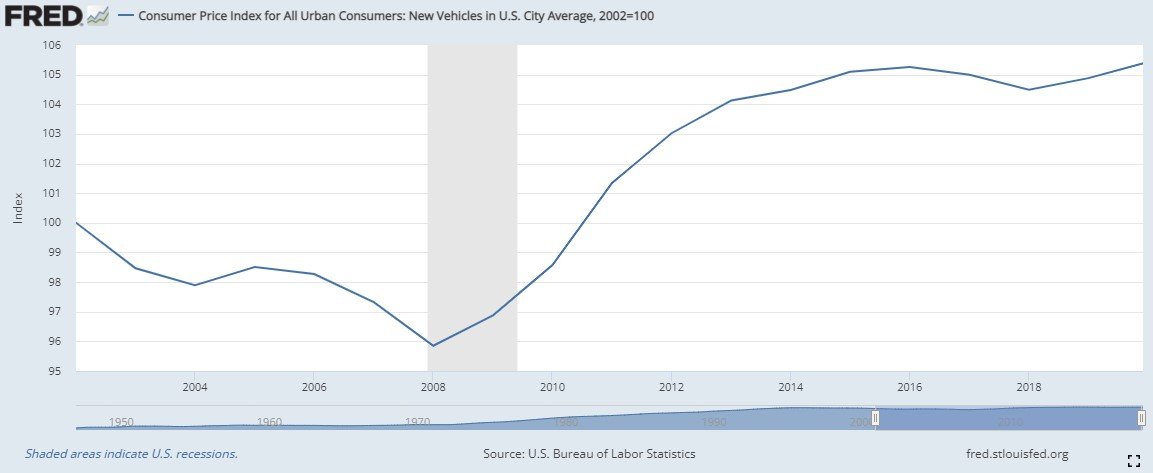
One reason is Hedonic Quality adjustments! They’re magical aren’t they……
Don’t get me wrong. There have been excellent improvements in car safety, gas mileage, ride quality and entertainment features between 2002 and 2019. But if I were to give you the option of buying a new 2002 model car for $25,854 (a 4.9% increase vs the 2002 average transaction price shown above), or the 2019 model for $37,200, which one would you choose?
What’s that? You’ll just buy used? ……. Doh!
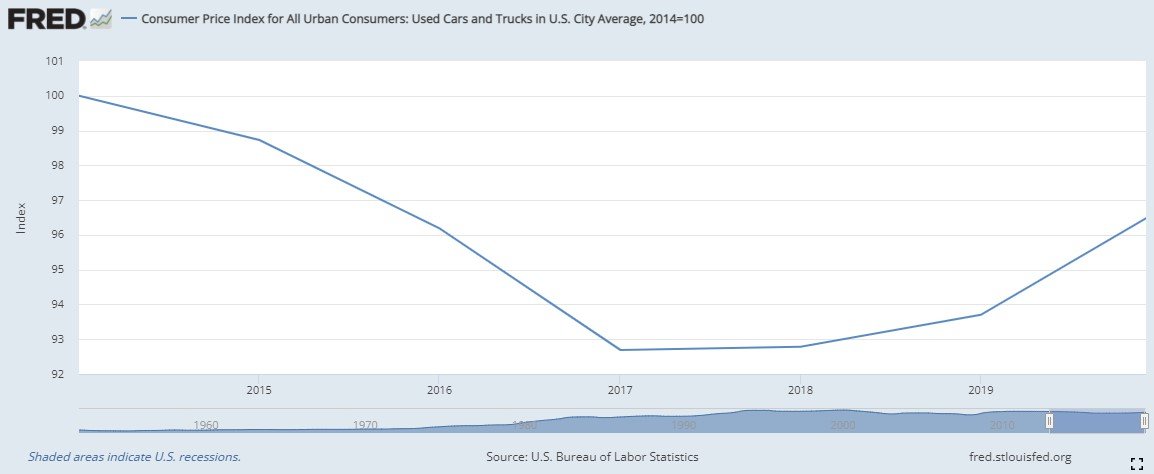
Used car prices are up 16% over the 2014-2019 period. 6
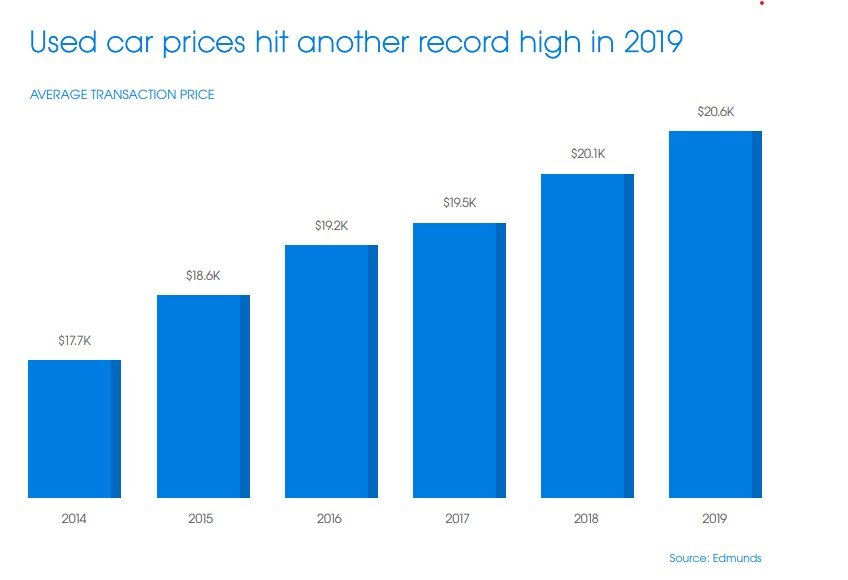
CPI used vehicle price index is down 3.3%.
Or maybe you’ll just stick with the base models. Sure, but you’ll have to pay for all the new standard features whether you want them or not.
Most unbiased, logical people will agree that there is a place for quality adjustments in an inflation measurement. Whether you agree or disagree with the methods or extent that they’re used is another story.
5. Substitution vs fixed basket weightings
In 1999 the BLS changed from using fixed category weightings to a geometric mean formula. Fixed weightings don’t allow for substitution between goods. The geometric mean allows for the adjustment of weightings within very specific categories due to substitution.7 According to the BLS, substitutions are allowed within very specific categories they call strata, not across categories or strata.
For example, it allows for the substitution of boneless skinless chicken breast (higher quality) to bone-in chicken legs (lower quality) due to an increase in chicken prices. It does not, however, allow for the substitution from steak to chicken.
In other words, if the cost of living becomes so expensive that consumers must reduce the quality of the goods and services they buy, the CPI sees that as a reduction in prices paid by consumers. No consideration is paid to the fact that we must consume lower quality goods and services even though we would prefer to continue to afford the higher quality items.
The CPI reports a lower rate of increase because the weighting of the lower quality, lower priced items go up while the weighting of the higher quality, higher priced items go down.
This change has reduced the annual growth rate of the CPI by about 0.3%.3
Where is the hedonic quality adjustment to account for this reduction in quality?
There isn’t one! HYPOCRISY
This may not sound like much. However, it equates to an additional 6.8% loss of purchasing power vs what we’ve “officially” experienced since 1999. In other words, the CPI would be 6.8% higher than its current level had the formula not changed.
Let me put that in another context for you. Someone receiving a $1,500 COLA payout would be receiving an additional $102 per month ($1,224 per year) than they current receive.
For many people living on a fixed or low income, that $1,224 would be very helpful.
Inflation Rates are Personal
When the BLS reports that the CPI went up by 6.2%, this is a weighted average. The BLS has designed these weights to reflect the “average consumer.”
The fact of the matter is that there is no inflation measure that applies to everyone. Even the BLS concedes that the CPI “seldom mirrors a particular consumer’s experience.”
Each individual, household, and business has its own inflation rate depending on the goods and services that they buy. Similarly, every good or service has its own inflation rate. If you spend a larger percentage of your income (relative to the BLS’s weightings) on highly inflationary items, then your personal inflation rate is likely higher than the headline CPI.
If you spend less on those items and/or you spend more on items not increasing in price as much, then it’s likely your personal inflation rate is lower than the CPI.
There are 3 components of your personal inflation rate:
1. Rate of price change – At what rate are items within each category increasing?
2. Weightings – What is your mix of goods and services?
3. Location – Where you live has an impact on the rate of price increases that you’ll experience
As I mentioned in the beginning of this section, accurately measuring inflation is an impossible job. Satisfying everyone’s personal beliefs about what an inflation metric should and should not measure or account for, is literally impossible. In my opinion, the BLS & BEA do an okay job at it.
You can make arguments for and against the inclusion of financial assets in the CPI and the use of HQAs. It starts getting suspect when we get into the use of implicit rent calculations for people who own their own home. It moves to utterly manipulated when using a geometric mean to allow for substitution between different quality items and then arguing that it’s a reduction in price.
When you point out that a lot of their techniques ignore factors that affect consumers ability to maintain a constant standard of living, they claim that their metrics shouldn’t be used in such a fashion. They define their metrics in a certain way so that they can always say that it’s not intended to be used like you’re using it. But then they talk about it being used for cost-of-living adjustments and deflating nominal values into real values. They can’t have it both ways.
One solution is to have several measurements that adjust and account for all these major scenarios. They should publish a metric that includes financial assets. They should publish a metric that includes house prices. They should publish a metric that tracks a fixed weight basket of goods and services. This way each interested party can choose the proper metric for the analysis that they’re doing.
Finally, true statisticians speak in terms of confidence intervals, not specific values. The BLS and BEA should adopt the same approach for the Consumer Price Index (CPI) & the Personal Consumption Expenditures Index (PCE).
In the final part of this series, I’ll provide 30 actionable steps you can take right now to protect yourself from the theft of inflation.
References
1 Gallup. What Percentage of Americans Owns Stock? By Lydia Saad and Jeffery M Jones. https://news.gallup.com/poll/266807/percentage-americans-owns-stock.aspx Accessed on 10/27/2021
2 US Bureau of Labor Statistics. Relative importance of components in the Consumer Price Indexes: U.S. city average, December 2020. https://www.bls.gov/cpi/tables/relative-importance/2020.htm Accessed 10/24/21
3 US Bureau of Labor Statistics. Common Misconceptions about the Consumer Price Index: Questions and Answers. https://www.bls.gov/cpi/factsheets/common-misconceptions-about-cpi.htm Accessed 10/27/2021
4 US Bureau of Labor Statistics. Hedonic Quality Adjustments in the US CPI” A Statistical Agency Perspective. https://www.bls.gov/cpi/white-papers/hedonic-quality-adjustments-statistical-agency-perspective.pdf Accessed 10/28/21
5 Automotive Industry Trends 2020. Edmunds. https://static.ed.edmunds-media.com/unversioned/img/industry-center/insights/2020-automotive-trends.pdf Accessed 10/30/2021
6 Used Vehicle Report: The Car Comeback | CY 2019. Edmunds. https://static.ed.edmunds-media.com/unversioned/img/industry-center/insights/2019-used-vehicle-report.pdf Accessed 10/30/2021.
7 US Bureau of Labor Statistics. Incorporating a geometric mean formula into the CPI. By Kenneth V. Dalton, John S. Greenlees, and Kenneth J. Stewart. https://www.bls.gov/mlr/1998/10/art1full.pdf Accessed 10/29/2021
Get Our Latest Delivered To Your Inbox
You will receive 1-2 emails per month and you can unsubscribe at anytime
Jump To

Leif Mullican
Leif is a 18 year financial services professional with expertise in finance, economics and financial/business analytics. His passions are his children, drums and healthy living. He started Adaptable Wealth to provide basic financial education while promoting a holistic view of wealth that includes your money, your health & your time. Too many people prioritize their money over their health & their time, & regret this decision once it's too late. You can reach out to him through LinkedIn, Twitter & YouTube by clicking the social platform links listed throughout this post. You can also email him at AdaptableWealth@yahoo.com
Read more from this author
Most popular Protect


Trending